


")


I was looking for a new hobby during the COVID lockdowns, so I decided to go back to my childhood and to check out Magic the Gathering; if you do not know what this is, it is a card game that you play against others and the Magic The Gathering Arena app is pretty awesome. However, something was bugging me, and with all card games, there is a luck element to it, and this was frustrating, so I decided on another childhood hobby, Chess. I signed up to Chess.com and started playing, badly, playing piece by piece and forgetting everything I learned as a child about openings, strategy, all that good theory, but it was refreshing to be learning this again.
I then watched The Queen’s Gambit on Netflix and during the show, the games were being shown on huge boards for the public to see, and I thought this was pretty cool, and as always, can I create something like this in Tableau?
In this tutorial, I will go into my thinking about how I created an animated Chess Game i.e. The Queen’s Gambit final game between Beth Harmon and Vasily Borgov.
You can find this data visualisation on Tableau Public here, although building this should take less than an hour: https://public.tableau.com/profile/toan.hoang#!/vizhome/ChessGameElizabethHarmonvsVasilyBorgov/ChessElizabethHarmonvsVasilyBorgov
Data
The first consideration is where I could find the data i.e. a list of moves? The nice thing is that in Chess you have Portable Game Notation (PGN) files for individual Chess games (thousands catalogued and available for analysis) as well as websites where you can view the game, for example, https://lichess.org/study/AgKEky06

Note: given the popularity of The Queen’s Gambit, there are literally hundreds of articles on this final game. Also, I am looking to take on a project where you can select any PGN file and then have Tableau animate it
Now that we can derive the list of moves, the question is how do we format our data? As I wanted to combine animations and page functionality, I figured that I need to capture the position of each piece on the board after every player move, so the following format should work:
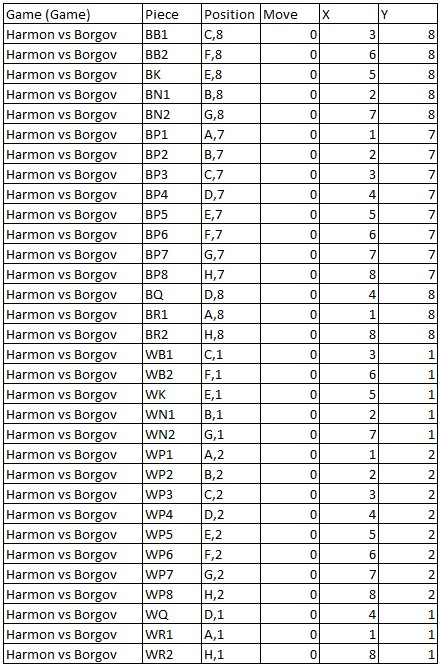
The challenge with this data is that there will be hundreds of lines, it will be hard to validate, and I know that I would make a mistake somewhere. As such, I decided on a format where I could read the game and would give me a lot more control of my data set:
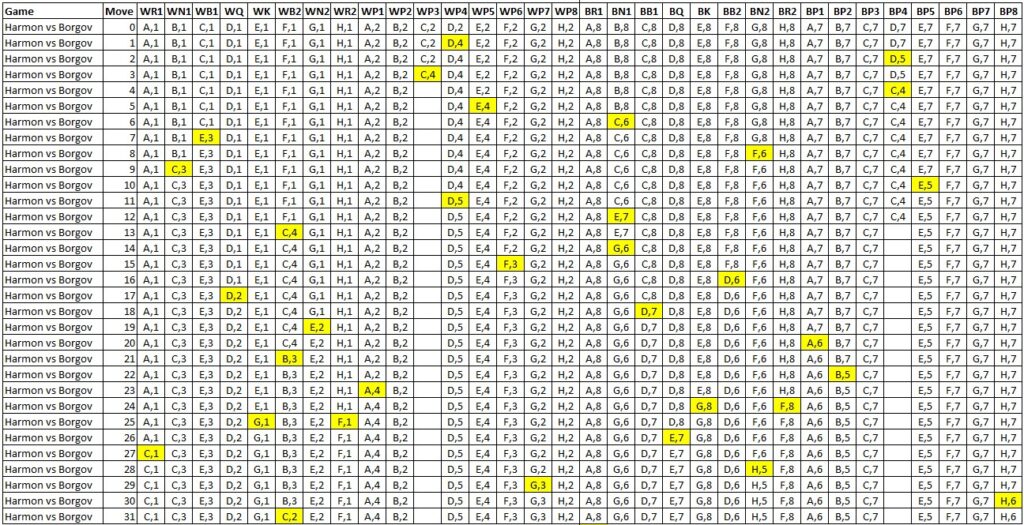
I will then pivot this data in Tableau to get the original data set; please download data file here and lets proceed to Tableau
Data Source Editor
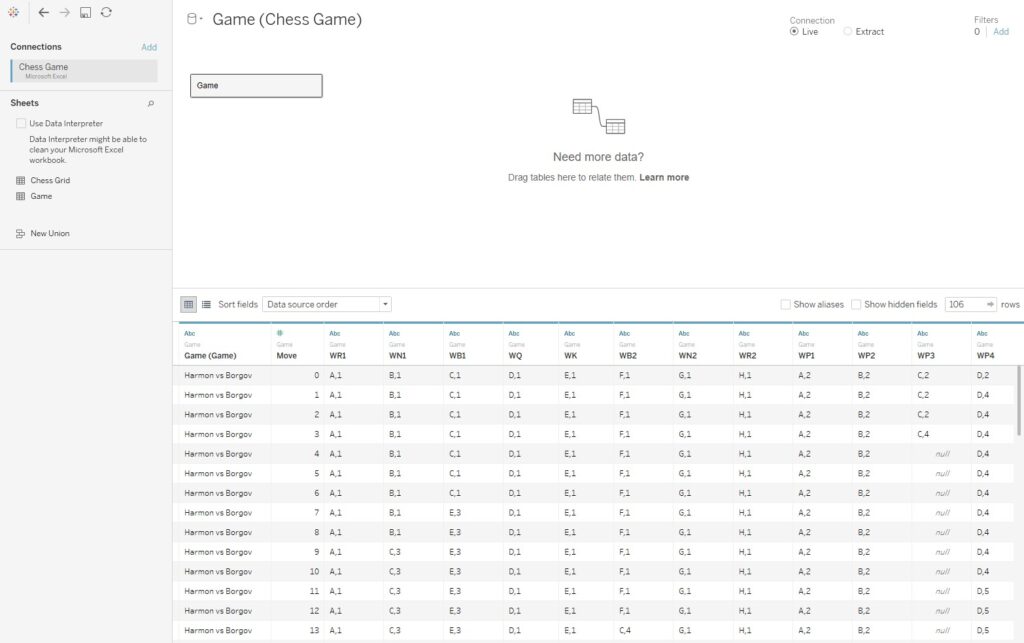
We will start by loading the Excel file into Tableau Public or Tableau Desktop. Open up Tableau, under Connect click on Microsoft Excel, and locate the downloaded file, with the file open drag Game onto the Query Panel, you should see the following:
We will now pivot our data by selecting all our piece columns (every column apart from Game and Move) right-clicking and selecting Pivot. Note: keeping your finger on shift allows you to select all columns but click on the first and the last. You should now see the following:

Lastly, I want us to rename Pivot Field Names to Piece and Pivot Field Values to Position. After which we can start building our worksheet
Calculations
With our data loaded, we are going to start by creating a few Calculations
Y
FLOAT(TRIM( SPLIT( [Position], ",", 2 ) ))We are using the SPLIT function to get the numeric position value after the comma
Letter
TRIM( SPLIT( [Position], ",", 1 ) )We are using the SPLIT function to get the isolated letter
X
FLOAT(IF [Letter] = "A" THEN
    1
ELSEIF [Letter] = "B" THEN
    2
ELSEIF [Letter] = "C" THEN
    3
ELSEIF [Letter] = "D" THEN
    4
ELSEIF [Letter] = "E" THEN
    5
ELSEIF [Letter] = "F" THEN
    6
ELSEIF [Letter] = "G" THEN
    7
ELSEIF [Letter] = "H" THEN
    8
END)
Basically, we are translating the letters in a chess position to a numeric value
And those are all the calculations that we need, however, one last step, right-click on the Move, X and Y and convert to Discrete Dimension
Worksheet
We will now create our Worksheet:
- Change the Mark Type to Shape
- Drag X onto the Columns Shelf
- Drag Y onto the Rows Shelf
- Right-click on this pill, go to Sort and select Descending
- Drag Y onto the Filters Shelf, and exclude Null
- Drag Move onto the Pages Shelf
If all goes well, you should now see the following:
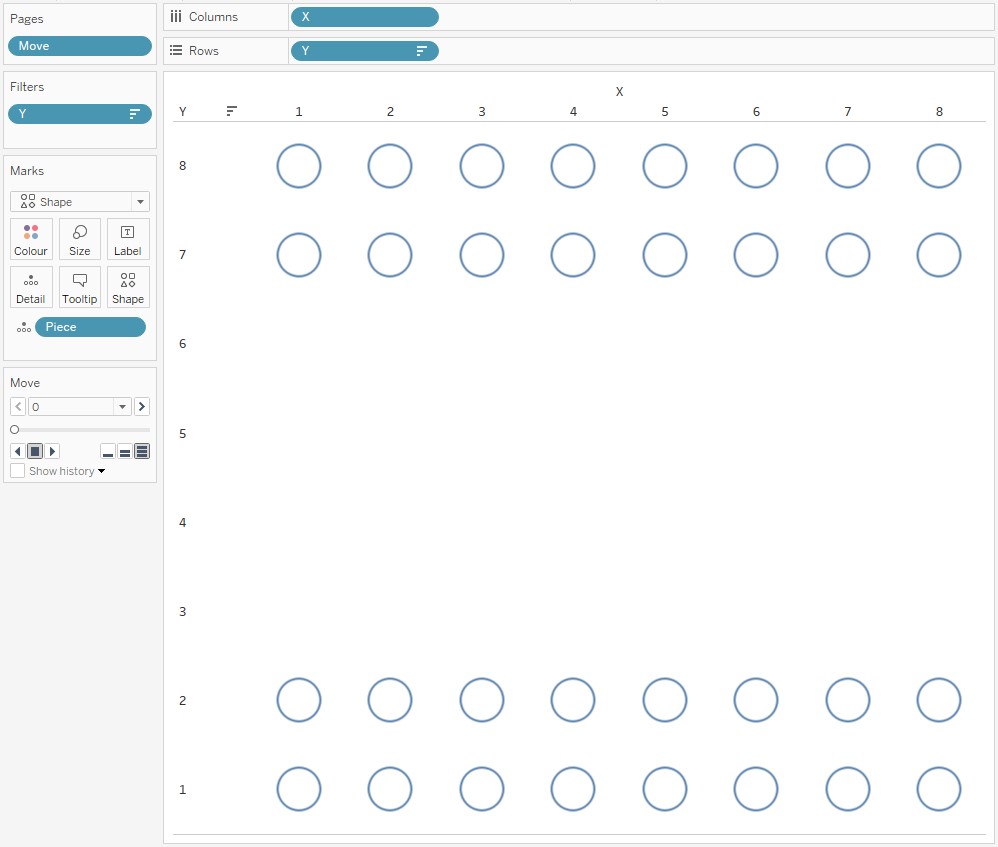
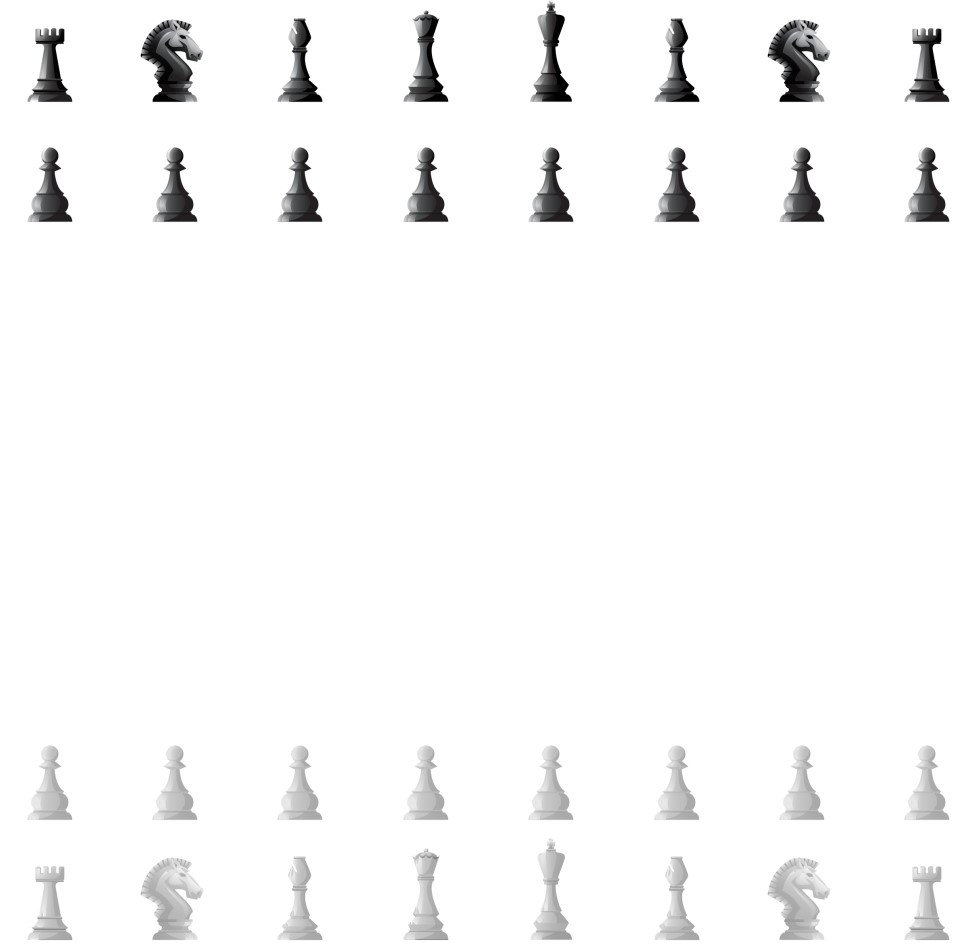
At this point, we have actually completed the functional side of this tutorial. Yes, we can actually click play and watch the game, however, it will be a little hard to see what is going on. So the next step is to get our icons. I spent about an hour downloading various images and then manipulating them in a graphics editor, but you can find Chess Piece Icons all over the internet (Google is your friend); I wrote a tutorial on using Custom Shapes here: https://tableau.toanhoang.com/tableau-qt-custom-shapes
In terms of our pieces:
- BR1 – Black Rook 1
- BN1 – Black Knight 1
- BB1 – Black Bishop 1
- BQ – Black Queen
- BK – Black King
- BB2 – Black Bishop 2
- BN2 – Black Knight 2
- BR2 – Black Rook 2
- BP1 – Black Pawn 1
- BP2 – Black Pawn 2
- BP3 – Black Pawn 3
- BP4 – Black Pawn 4
- BP5 – Black Pawn 5
- BP6 – Black Pawn 6
- BP7 – Black Pawn 7
- BP8 – Black Pawn 8
- WR1 – White Rook 1
- WN1 – White Knight 1
- WB1 – White Bishop 1
- WQ – White Queen
- WK – White King
- WB2 – White Bishop 2
- WN2 – White Knight 2
- WR2 – White Rook 2
- WP1 – White Pawn 1
- WP2 – White Pawn 2
- WP3 – White Pawn 3
- WP4 – White Pawn 4
- WP5 – White Pawn 5
- WP6 – White Pawn 6
- WP7 – White Pawn 7
- WP8 – White Pawn 8
Once you have applied your shapes, you should see something like the following:
This is actually where we can complete the tutorial, we just need a good background image and voila, we are complete, however, I spent a whole 15 minutes looking for a good image of a Chessboard before I gave up and decided to create my own in Tableau; that way, I can adjust the colours and get exactly what I want.
Chessboard
In the Excel Spreadsheet you downloaded, we have a second sheet called Chess Grid, so let us set up our Chessboard:
- Load the Chess Grid into our Tableau Workbook
- In the Data Pane, select the Game data source
- Select Letter, X, Y, right-click and select Copy
- In the Data Pane, select our Chess Grid data source
- Click on a blank space and select Paste
- Yes, we can copy and paste formulas between data sources and it is a massive time saver.
Now we can build a new worksheet:
- Change the Mark Type to Square
- Drag X onto the Columns Shelf
- Drag Y onto the Rows Shelf
- Right-click on this pill, go to Sort and select Descending
- Drag Color onto the Colour Mark
- 0 is White
- 1 is whatever works well with your icons
You should end up with the following:

And the last step is to bring both sheets (floating) onto a dashboard, align them on top of each, you want to end up with the following:
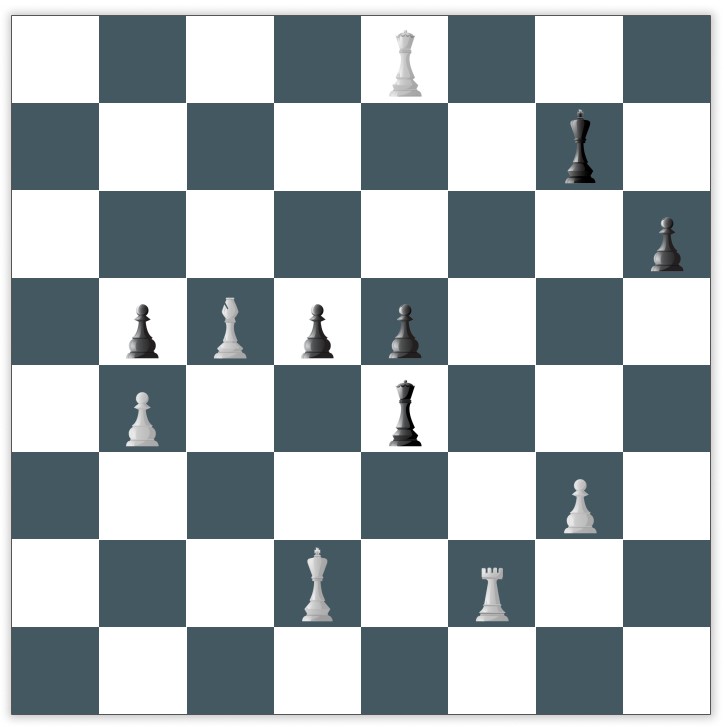
and with that said, we are done with this tutorial.
Summary
A great way to have fun with Tableau is to apply Tableau to your hobbies, and this is exactly what I have done here. Will Chess stay with me until I am an old man? Who knows, but I really do hope you picked up a thing or two, in any case, I hope you enjoyed this and whilst I have been quiet on new tutorials I have some very cool stuff coming in 2021, so stay tuned.


 Table Calculation")


Great tutorial, it’s actually really simple when you demonstrate how it’s put together, but looks great! The behind the scenes Excel work looks it would have been the most complicated piece of the puzzle.
Yes, the data prep side took the most time, the rest is easy. I am looking to find a way to rapidly automate the data source. It is a pet project for the new year.