Creating a Single Level Dendrogram in Tableau
My initial name for this tutorial was the Orgasmatron (head massager company name out of Australia), the name is fun, strange as hell but we have to have some fun right?...
Drawing Square Radial Bar Charts in Tableau
One of the most read tutorials on Tableau Magic is my Radial Bar Chart Tutorial. As more Tableau enthusiast check out our website, we are getting more requests for a tutorial...
Sigmoid Area Charts in Tableau
I was working on an update to our Curved Line Charts and thought about turning this onto a Curved Area Chart, or Sigmoid Area Chart. I am going to be exploring...
Drawing Arc Maps in Tableau
As of 2019.2, Tableau now has the MakePoint and MakeLine Functions that makes this process a lot easier. I would recommend using the technique described in this tutorial only if...
Drawing Layered Filled Circle Charts
I created this bespoke data visualisation I had more time and more actively participating in #MakeoverMonday and for the UNESCO-IHE. I wanted to create a slightly different take on a stacked...
Double, Spaced Doughnut Chart Tutorial
After the United Kingdom 2017 General Election, on Thursday 8th June 2017, I had many conservations about our First Past The Post system (FPTP), and why we do not have a Proportional...
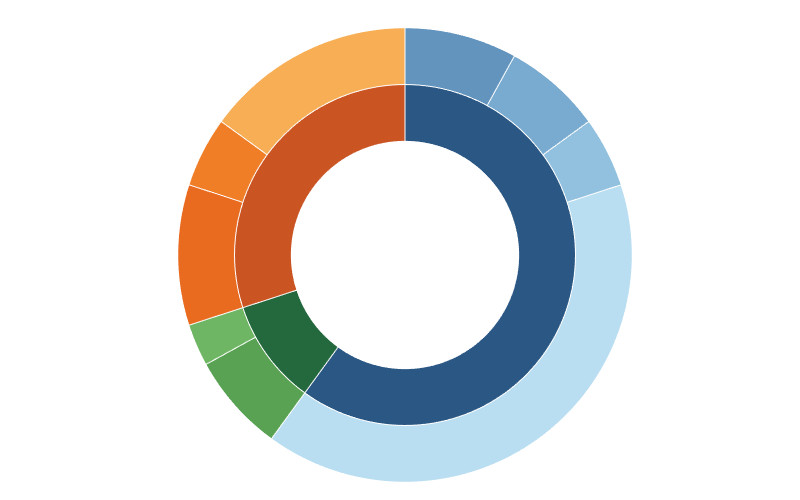
Sunburst Chart Tutorial
When I started to learn Tableau, I remember being completely amazed and confused about how to build Bora Beran’s blog on Sunbursts; I could not believe that this was possible in Tableau...
Creating Half Circle Gauge Charts in Tableau
Requested from a friend, here is a nice and simple tutorial on creating Half Circle Gauge Charts in Tableau. In this tutorial, we are going to show the colour-coded percentage out...
Gauge Chart (With Arrow)
As of the time of this article, I am a two-time Tableau Zen Master, and, as such, I am afforded several different types of opportunities from Tableau. One such opportunity is...
Filled Circle Charts in Tableau
I created this tutorial a little while ago, but the math did not quite add up, so I had to remove the tutorial. After a little while decided to revisit this, and as such, here is my latest version of my Filled Circle Tableau data visualisation tutorial.


