Drawing Satellite Charts and Variations in Tableau
A lot of the articles written have either come from browsing bespoke designs or through client requests. I am normally the one that is called in when a client requests a...
Tableau UI / An Introduction
Tableau UI is a React component library containing UI components for building web applications with the Tableau look-and-feel. In this introductory tutorial, we will set up our development environment (and relevant...
Drawing Google Logos
I do not believe that everything you do in Tableau has to be serious, and sometimes, just sometimes, it is good to have some fun. As such, we are going to...
Radial Bar Chart Tutorial
I love drawing data visualisations with Tableau and in this tutorial, we are going to build Radial Bar Chart. For my data set, I am going to use the #MakeoverMonday’s American...
Tableau and R / An Introduction
One of the Tableau topics I am frequently asked is can we integrate Tableau with the R programming language for statistical computation? The answer is yes, Tableau can be integrated with...
Double, Spaced Doughnut Chart Tutorial
After the United Kingdom 2017 General Election, on Thursday 8th June 2017, I had many conservations about our First Past The Post system (FPTP), and why we do not have a Proportional...
Dual-Metric Doughnut Chart Tutorial
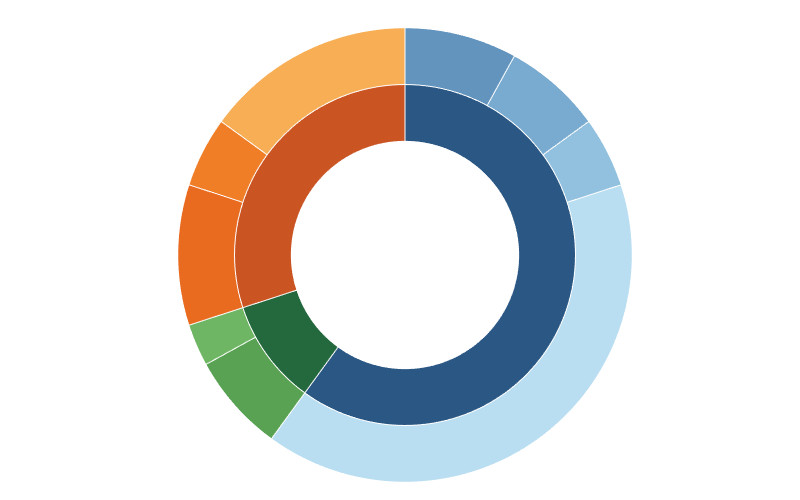
I created this data visualisation in Tableau when I was exploring Sunburst charts, and drawing polygons, but never did release an article on it. But given I just finished my article...
Introducing TabJolt
When deploying Tableau an Enterprise we the end-users do not just get a slick data-discovery, self-service and data visualisation tool, but something quicker than they have ever seen before. When deploying...
Understanding Level of Detail (LOD) Expressions
Prior to Level of Detail (LOD) Expressions, we had to make a extensive use of Table Calculations, but LOD has added a new element to the game and well worth looking...
Arc Chart Tutorial
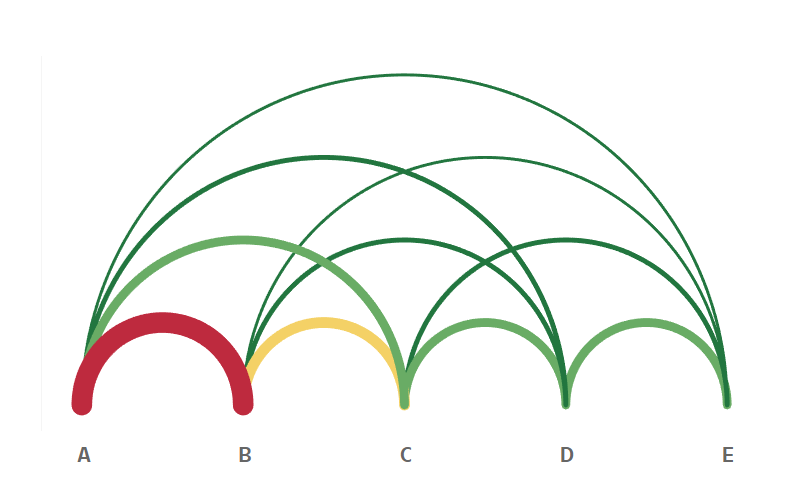
After years of using Tableau, I was finally given a use case that would allow me to create an Arc Chart; I always strive to build the best visualization for the client’s requirements. The client wanted to visualize...


