Video: Tableau with Music / Curved (Sigmoid) Area Chart
Tableau with Music / Curved (Sigmoid) Area Chart. This is a very different take on an area chart using Data Densification, Table Calculations and the Sigmoid Function to create this using...
Tableau QT: Wilkinson Plot
I wanted to have some fun, so I put together a quick tutorial for creating a Wilkinson Plot in Tableau, and within 10 minutes or less.Note: This is an alternative type...
Tableau QT: Connected Bar Charts
This is a Quick Tip on how to build a Connected Bar Charts in Tableau, so less reading and more jumping in. We are going to spend 5 minutes or less...
Video: Tableau with Music / Curve Bar Charts
Tableau with Music / Curved Bar Chart. This awesome variation of a Bar Chart leverages Data Densification and Table Calculations to create this awesome effect over the Sample Superstore Data Set.https://www.youtube.com/watch?v=9gtdra7260UWritten...
Creating Gradient Radial Bar Charts in Tableau
This is an update to one of my original Tableau Tutorials, here is a tutorial for creating Gradient Radial Bar Charts in Tableau; I hope you enjoy this and pick up...
Introducing TabJolt
When deploying Tableau an Enterprise we the end-users do not just get a slick data-discovery, self-service and data visualisation tool, but something quicker than they have ever seen before. When deploying...
Tableau QT: Lollipop Charts
This is a Quick Tip on how to build lollipop charts in Tableau, so less reading and more jumping in. We are going to spend 5 minutes or less building our...
Creating Squared Spiral Column Charts in Tableau
Two weeks ago, we released our Spiral Column Chart Tutorial in Tableau using the Line Mark Type. In this tutorial, we are going to create a Squared version using the Polygon...
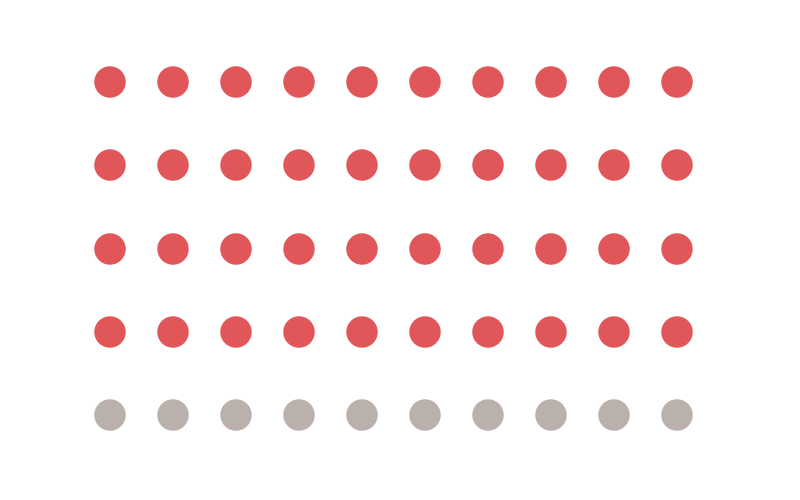
Dot Matrix Tutorial
A friend messaged me to ask he could create a grid layout for different visualisations, for example, a 3×3 grid. I immediately thought about a Dot Matrix visualization and how I could create...
Tableau QT: Connected Scatter Plots
In this Tableau quick tip, we are going to walk through the creation of a Connected Scatter Plots in Tableau in 5 minutes or less. Something very simple and fun.DataWe will...


