


")


Since I released my Dendrogram tutorial I have been inundated with requests on how to a multi-level version. So, in this tutorial, we are going to leverage some interesting techniques to get this effect. I hope you enjoy.
Note: This is an alternative type of data visualisation, and sometimes pushed for by clients. Please always look at best practices for data visualisations before deploying this into production.
Data
Load the following data into the Tableau Public / Tableau Desktop
Dimension,Level,Parent,Value
North America,1,,312
South America,1,,217
Europe,1,,290
Asia,1,,70
Africa,1,,194
Mexico,2,North America,95
United States,2,North America,80
Canada,2,North America,77
Panama,2,North America,60
Brazil,2,South America,45
Chile,2,South America,40
Argentina,2,South America,35
Colombia,2,South America,47
Peru,2,South America,20
Venezuela,2,South America,30
Germany,2,Europe,80
United Kingdom,2,Europe,60
France,2,Europe,55
Italy,2,Europe,50
Netherlands,2,Europe,45
China,2,Asia,10
India,2,Asia,15
Japan,2,Asia,20
South Korea,2,Asia,25
South Africa,2,Africa,34
Nigeria,2,Africa,36
Kenya,2,Africa,40
Ghana,2,Africa,30
Tunisia,2,Africa,25
Senegal,2,Africa,29
Once your data is loaded into Tableau, right-click on the data source and click on Edit Data Source… with the Data Source Editor open, paste the following:
Path
1
100
Note: If you are using Tableau 2020.2 or great i.e. have access to new Relationship Model, you will need to double-click on the originally pasted data source to open up before pasting in the Path Data.
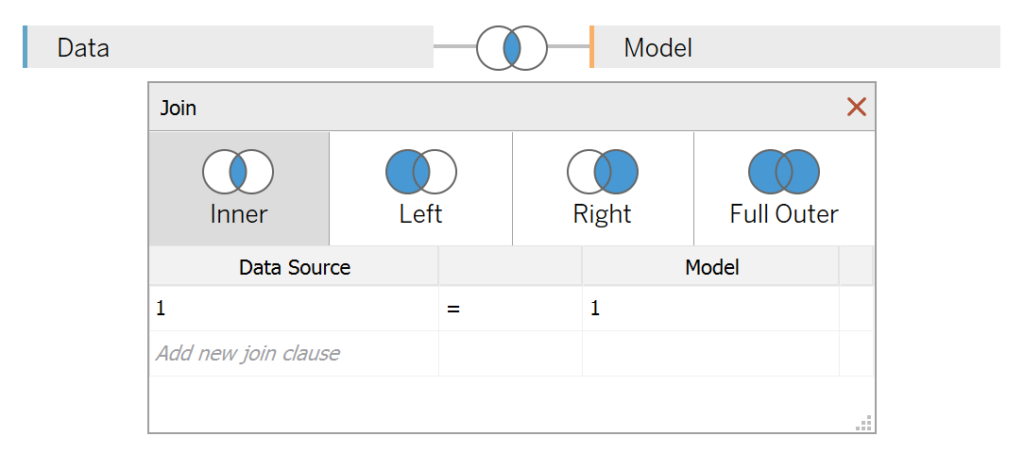
You should get an error as there is no joining column, however, click on Add new join clause, go to Create Join Calculation, type 1 and click OK. Do this for the right-hand side as well. Ensure that you have Inner join selected and you should see the following:
Note: we will be performing data densification to be able to draw our curves
Calculated Fields
With our data set loaded into Tableau, we are going to create the following Calculated Fields:
@Continent Parameter
- Set Name as @Continent
- Set Data type as String
- Set Allowable values as List and add the following values
- Africa
- Asia
- Europe
- North America
- South America
- Set Current value to South America
@Region Y Position Parameter
- Set Name as @Region Y Position
- Set Data type to Float
- Set Current value to 0
Path (bin)
- Right-click on Path, go to Create and select Bins…
- In the Edit Bins dialogue window:
- Set New field name to Path (bin)
- Set Size of bins to 1
- Click Ok
Filter
IF [Level] = 1 OR ([Level] = 2 AND [@Continent] = [Parent]) THEN
    TRUE
ELSE
    FALSE
END
TC_Level
WINDOW_MAX(MAX([Level]))TC_Value
WINDOW_SUM(SUM([Value]))/2TC_Rank
RANK_UNIQUE([TC_Value],"asc")X
((INDEX()-1)*0.12)-6Columns
[X]+(([TC_Level])*18)-12TC_Sigmoid
1/(1+EXP(-[X]))Y
([TC_Sigmoid]*([TC_Rank]-(WINDOW_MAX([TC_Rank])+1)/2)/100)
+IIF([TC_Level] = 2, [@Region Y Position], 0)
TC_Max Y
IF [Y] > 0 THEN
    WINDOW_MAX([Y])
ELSE
    WINDOW_MIN([Y])
END
Zero
0With this done, let us start creating our data visualisation.
Worksheet
We will now build our worksheet:
- Change the Mark Type to Line
- Drag Filter onto the Filter Shelf and select True
- Drag Level onto the Color Mark
- Drag Dimension onto the Detail Mark
- Drag Path (bin) onto the Columns Shelf
- Right-click on this pill and ensure that Show Missing Values is selected
- Drag this pill onto the Path Mark
- Drag Columns onto the Columns Shelf
- Right-click on this pill, go to Compute Using and select Path (bin)
- Drag Y onto the Rows Shelf
- Right-click on this pill, go to Compute Using and select Path (bin)
If all goes well, you should see the following:

We will now adjust the Table Calculations to get our Dendrogram:
- Right-click on the Y-pill and go to Edit Table Calculations
- In Nested Calculations select Y
- Set Compute Using to Specific Dimensions
- Ensure that Path (bin) and Dimension is selected and ensure that Path (bin) is on top
- In Nested Calculations select TC_Rank
- Set Compute Using to Specific Dimensions
- Ensure that only Dimensions is selected
- In Nested Calculations select Y
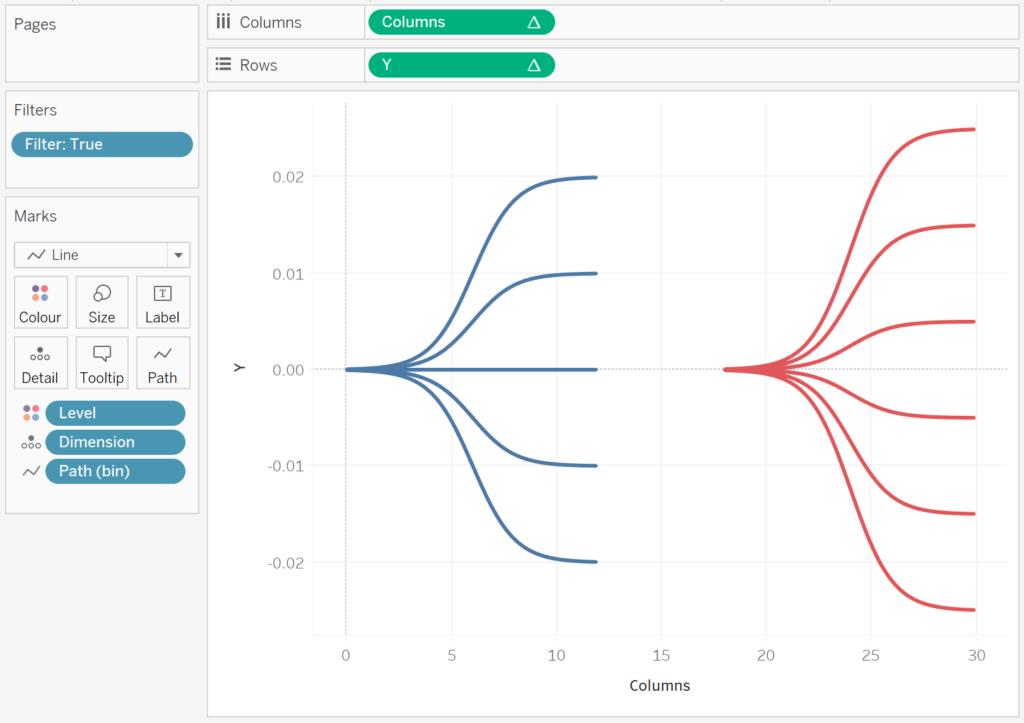
Simple huh, but if all goes well, you should now see the following:
Now, we will add our text labels:
- Drag Dimension onto the Label Mark
- Drag TC_Value onto the Label Mark
- Right-click on this pill, go to Compute Using and select Path (bin)
You should now see the following:

Now, to add our interactivity, we will now add two Parameter actions and a Highlight action.
- Drag Zero onto the Detail Mark
- Right-click on this pill and convert it to a Discrete Dimension
- Go to the Worksheet Menu and select Actions…
- Click on Add Actions and select Change Parameter…
- Set Run action on as Select
- Set Target Parameter as @Continent
- Set Field as Dimension with the Aggregation as None
- Click Ok
- Click on Add Actions and select Change Parameter…
- Set Run action on as Select
- Set Target Parameter as @Region Y Position
- Set Field as Y with the Aggregation as None
- Click Ok
- Click on Add Action and select Highlight…
- Set Run action on as Select
- In Target Highlighting select Selected Fields and check Zero
- Click Ok
- Click on Add Actions and select Change Parameter…
You should now have the interactive two level Dendrogram:

Lastly, we will adjust the formatting:
- Double click on the Columns Header and Fix the range to be from -1 to 36
- Hide the Columns Header
- Hide the Y Header
- Hide the Gridlines
- Hide the Zero Lines
- Format the Label
You will want to end up with something like the following:

and boom, we are done! I hope you enjoyed creating this data visualization and learned some cool techniques as well. As always, you can find this data visualisation on Tableau Public at https://public.tableau.com/profile/toan.hoang#!/vizhome/Multi-LevelDendragram/Multi-LevelDendrogram
Summary
I hope you all enjoyed this article as much as I enjoyed writing it and as always do share the love. Do let me know if you experienced any issues recreating this Visualization, and as always, please leave a comment below or reach out to me on Twitter @Tableau_Magic. Do also remember to tag me in your work if you use this tutorial.
If you like our work, do consider supporting us on Patreon, and for supporting us, we will give you early access to tutorials, exclusive videos, as well as access to current and future courses on Udemy: https://www.patreon.com/tableaumagic
 Table Calculation")


Hi Magician thanks for yet another wonderful chart, I was able to recreate the report without any issues.
The images are not getting loaded in the page.
I am getting this error when I try to load image,We cannot complete this request, remote data could not be fetched
Could you please make the workbook downloadable I am having issue when I select country the action works for second dendogram as well
You will need to adjust your parameter actions.
ok will check
Hi Toan, I tried fixing but I am unable to do that, pls find the link for my dashboard in tableau public below,
https://public.tableau.com/views/MultiLevelDendogram/Multi-LevelDendogram?:display_count=y&publish=yes&:origin=viz_share_link
Could you pls let me know whats the issue
Dear Toan,
Having difficulty with the Multi Level Dendrogram. Have tried 3 times. Incremental images are not appearing so I cannot tell where I am going off track. Here is the Tableau Public link. Maybe you can see my issue by looking at that… Thank you.
Pat Boyle
https://public.tableau.com/profile/pat.boyle#!/vizhome/MultiLevelDendrogram/Sheet22?publish=yes
Hey, i had the same issue, you need to drag Parent into detail too.
Thanks Toan for the entry!
Hi Dani M,
Thank you.
Dear Toan and Dani
Thank you for the tutorial and the assistance. Worked out well. I fiddled w the colors a bit, making the Continents a prime color and the countries a shade of the continent color. Looks great to me.
https://public.tableau.com/profile/pat.boyle#!/vizhome/MultiLevelDendrogram/MultiLevelDendrogram?publish=yes
Very cool, good work 🙂
Hi there. I tried doing this with my own data set where I have 2 parent categories and 6 in each parent. Unfortunately after creating the whole thing, when I select the 2nd parent category, the 2nd level dendogram shifts below the structure and hence is not synced with the first level. Could you help me with why could this be?
I’m having a similar issue, but with all of the second level items. I’m only able to get one set to appear at a time (there should be four) and they all appear below the parent dendrogram rather than connected to the parent line. Did you find a solution?
Hi @Pat Boyle would you mind telling how you achieved in coloring the way you said you did. I tried giving the continents different color and the countries a shade of their individual ones but its not working.
Hi Pat,
The viz looks amazing. However there is one glitch where in once you click any node in the countries level, the entire dendrogram tend to shift up or down.
I have tried many workarounds but none have worked.
@ToanHoang request your help with this as your viz works just perfect.
Regards
Snehasish
Similar issue. Any luck resolving this ?
Hi i built the multi level Dendogram for 6 levels and unfortunately it shows only 3 levels at one time on the view . I want to see a full structure from level 1 to 6 in the view. Can you tell me which field(calculation) i need to play around with to get to the desired view.
Hi there, I have not tried that many levels, if you can, please send me the packaged workbook to toan.hoang@tableau.toanhoang.com and I will have a look.
Hi, were you able to figure this out? I have the same requirement, to create a 6 level dendrogram. Can you please share how you did this?
I am stuck on adding the PATH value to the data source?
If you are using Tableau 2020.2 or great i.e. have access to new Relationship Model, you will need to double-click on the originally pasted data source to open up before pasting in the Path Data.
else just save the Path 1,100 in another excel sheet and do an inner join on 1=1
Option 3.
Add a new column in your dataset named path.
ex: you will have 3(+1) columns a,b,c,path
a,b,c,path
apple,ball,cat,1
apple,ball,cat,100
Thanks so much for sharing these! I can’t get the highlight action to include the level 1 selection and all level 2, like the one you published. Any ideas?
Hi @Toan Hoanq thank you for such an amazing viz. I have tried building the multi level dendrogram on my dataset. But the first level dendrogram looks more compact for ” A” (in my dataset) when i select the node. I understand this is because it has greater number of nodes around 29 of them. How do I make it more spread out like when I click on other nodes in the same level.
Below is the tableau public link
https://public.tableau.com/profile/snehasish.choudhury#!/vizhome/Finaldendrogram/Sheet1
TIA.
Regards
This is a great visualization attempt. To add new items in Level 1, Level 2 items or insert new level (say level 3), what measure value needs to be adjusted ? I can do it by trial and error, appreciate if someone already did that to save time. The visualization becomes distorted,if i don’t adjust X,Y,Columns,Value measure.
Great Viz!!
Which specific calculation affects the axis? In other tutorials on the web we have to fix a specific axis in the end to align/show all the viz. Here its being done automatically