


")


I saw the following while looking for inspiration and thought that this would be fun to build, to build this visualisation as well as to include some neat variations. This should be a very nice and quick data visualisation to draw in Tableau.
Note: This is an alternative type of data visualisation, and sometimes pushed for by clients. Please always look at best practices for data visualisations before deploying into production.
Data
Load the following data into Tableau Desktop / Public.
| Path | Value |
| 1 | 0.6 |
| 361 | 0.6 |
Note: we need two records for each Country as we are going to be drawing lines and using densification to get more points on our canvas. For more information, check out our article on Data Densification.
Calculated Fields
With our data set loaded into Tableau, we are going to create the following Calculated Fields and Bins:
Create Path (bin)
- Right click on Path, go to Create and select Bins…
- In the Edit Bins dialogue window:
- Set New field name to Path (bin).
- Set Size of bins to 15.
- Click Ok.
Now let us create the following Calculated Fields:
Index
INDEX()-1TC_Step Size
(WINDOW_MAX(MAX([Path]))/(WINDOW_MAX([Index])))*
(((WINDOW_MAX([Index]))-1))/(WINDOW_MAX([Index]))
Note: This is the complicated part of this tutorial, have a shot at figuring out this calculation.
X
SIN(RADIANS([Index]*[TC_Step Size]))Y
COS(RADIANS([Index]*[TC_Step Size]))TC_Color
IF [Index]/WINDOW_MAX([Index]) < WINDOW_MAX(MAX(Value)) THEN
    "Color"
ELSE
    "Grey"
END
Zero
0So now that we have created a lot of Calculated fields, we will now put this together into a Worksheet.
Worksheet
We will now build our worksheet:
- Change the Mark Type to Circle.
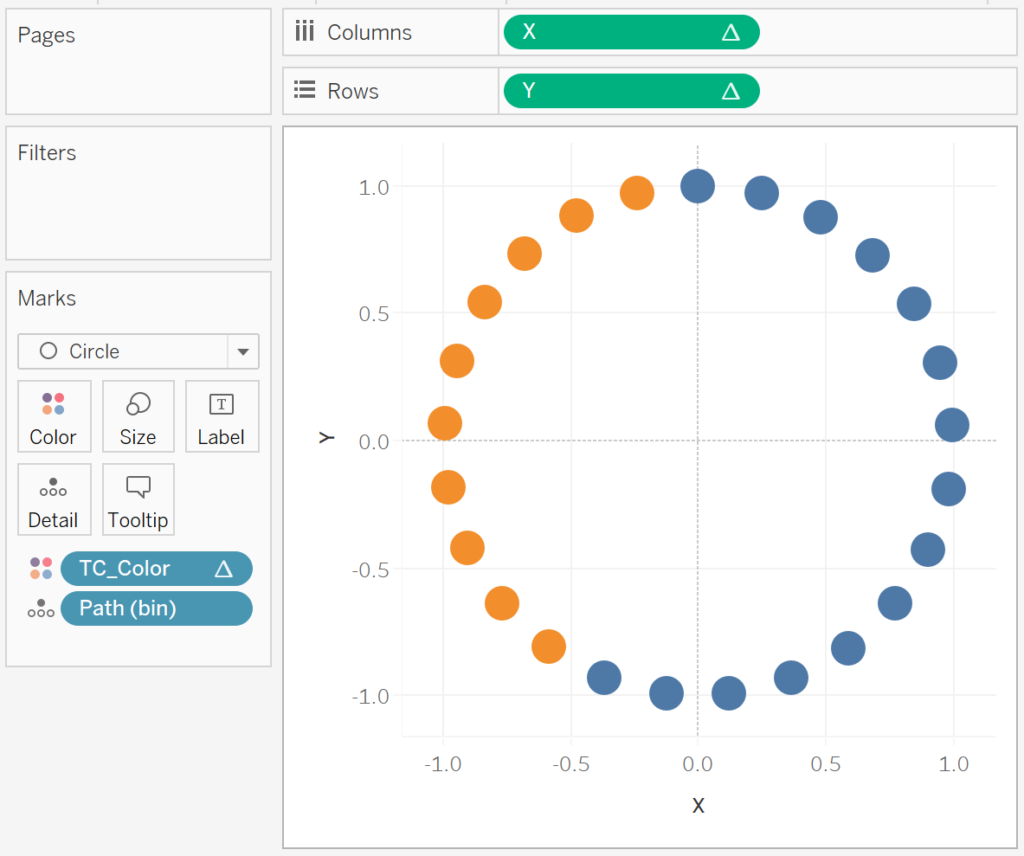
- Drag Path (bin) onto Columns.
- Right-click on this object, ensure that Show Missing Values is selected.
- Drag this object onto the Detail Mark.
- Drag X onto Columns.
- Right-click on this object, go to
Compute Using and select Path (bin).
- Right-click on this object, go to
- Drag Y onto Rows.
- Right-click on this object, go to
Compute Using and select Path (bin).
- Right-click on this object, go to
- Drag TC_Color onto Color Mark.
- Right-click on this object, go to
Compute Using and select Path (bin).
- Right-click on this object, go to
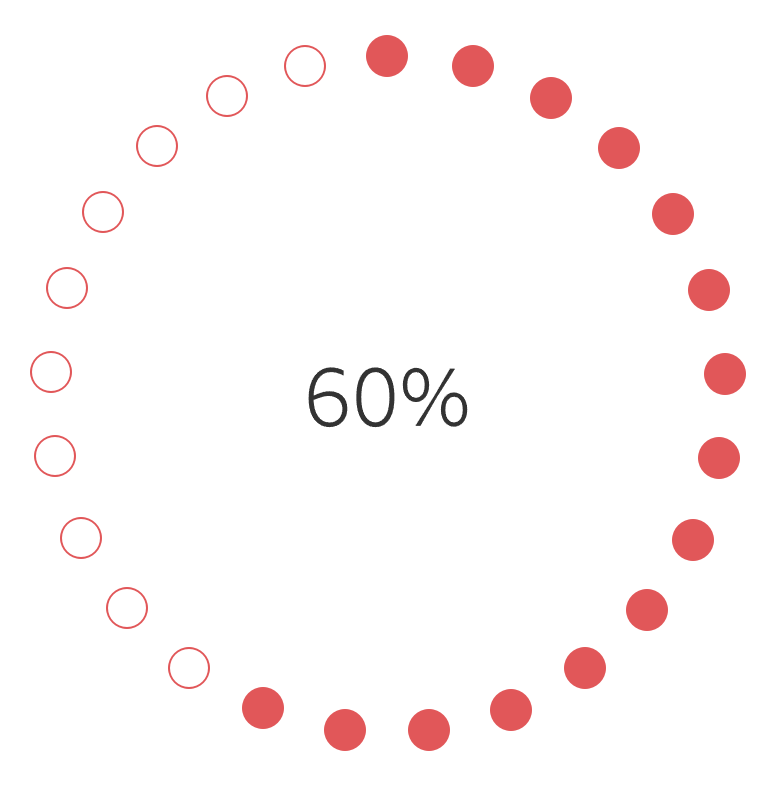
If all goes well, you should now see the following:
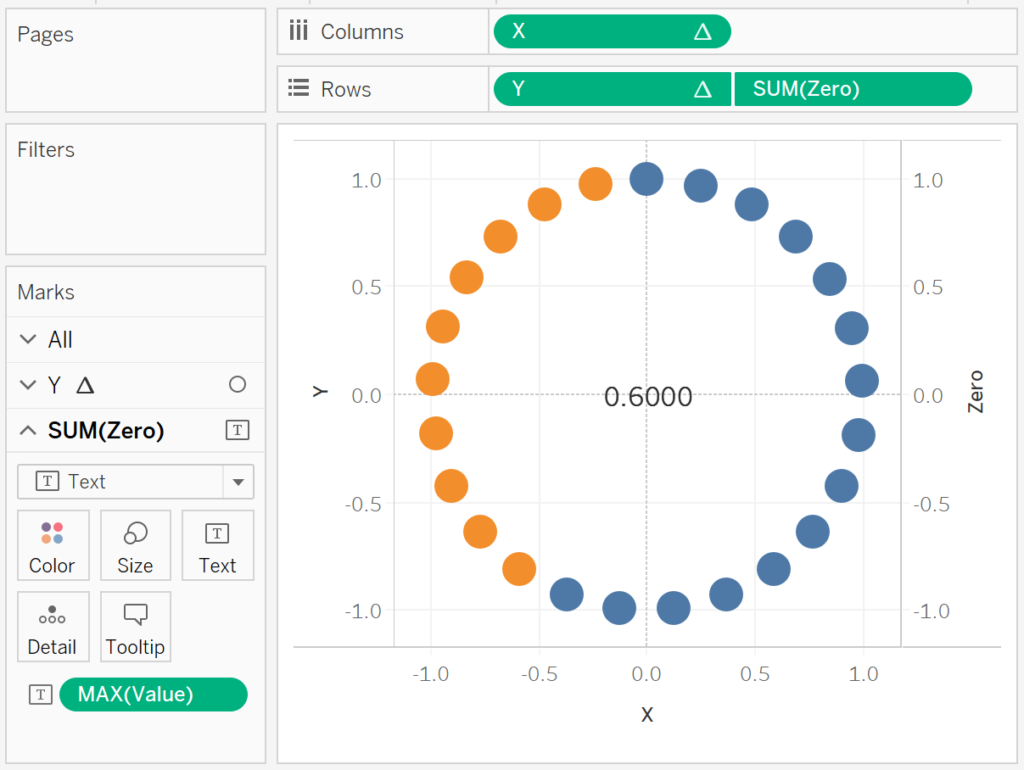
Now we will add the text to the center of the circle:
- Drag Zero onto Rows.
- Right-click on SUM(Zero) and select Dual Axis.
- Right-click on the axis and select Synchronize Axis.
- In the SUM(Zero) Mark panel, remove all objects.
- Change the Mark Type to Text.
- Drag Value onto Text. Right-click on this object and set the aggregation to Maximum.
- If not values are shown, click on null in the bottom right, and select “show data at default position”.
You should now see the following:
Now we will adjust the cosmetics:
- Hide Axis Headers.
- Set Row Divider to None.
- Set Column Divider to None.
- Set Grid Lines to None.
- Set Zero Lines to None.
- Format the value to Percentage.
- Set the Color.
- Set the Size.
You will want to have the following:
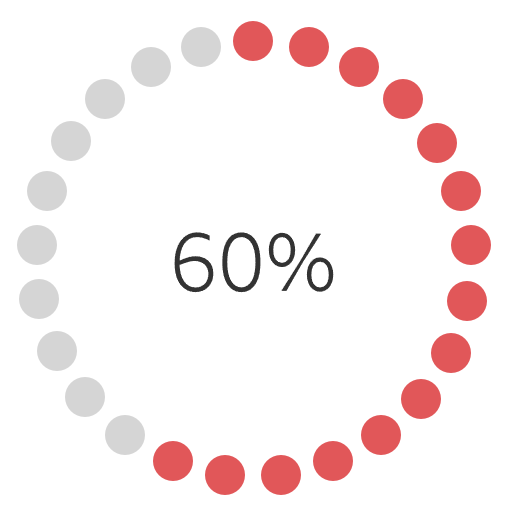
and boom, we are done with this visualisation, you can find my data visualisation on Tableau Public at
https://public.tableau.com/profile/toan.hoang#!/vizhome/CircleDotCharts/CircleDotChart
…but before we go, let us try to create some variations.
Variation 1
Drag Index onto Size, and set Compute Using to Path (bin). We will get the following:
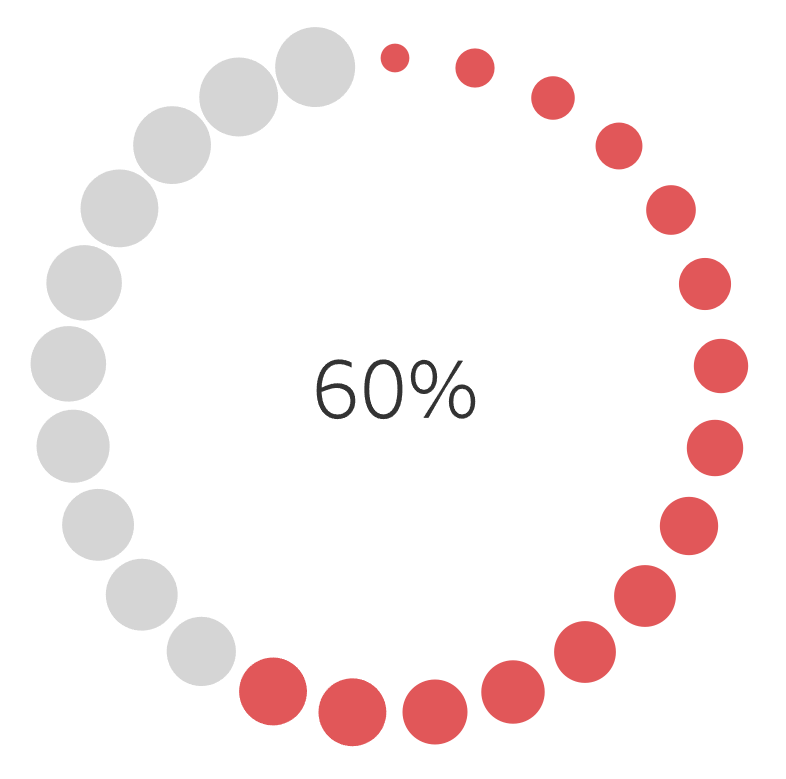
Variation 2
Edit the Object Color and Border Color to get the following:
Summary
I hope you all enjoyed this article as much as I enjoyed writing it and as always do share the love. Do let me know if you experienced any issues recreating this Visualisation, and as always, please leave a comment below or reach out to me on Twitter @Tableau_Magic.
If you like our work, do consider supporting us on Patreon, and for supporting us, we will give you early access to tutorials, exclusive videos, as well as access to current and future courses on Udemy:
- Patreon: https://www.patreon.com/tableaumagic
Also, do be sure to check out our various courses:
- Creating Bespoke Data Visualizations (Udemy)
- Introduction to Tableau (Online Instructor-Led)
- Advanced Calculations (Online Instructor-Led)
- Creating Bespoke Data Visualizations (Online Instructor-Led)
 Table Calculation")


Hi Toan,
How to create a path in the data set?
Check out our blog on data densification.
Thanks,
It’s help me. Is it advisable to apply this in large data sets?
Give it a try and let me know, I tried this with 50k records and it worked ok.
Hi Toan, as a Chinese Tableau lover, I do really appreciate your tutorials and dedications on sharing those Magic’s in Tableau. Though there are a lot of guys translating your article and repost in their own blog for gathering reputations. But I know you are definitely the owns for those credits. Thank you Toan.
Hi There, and thank you for your support. I am curious, if you have any links, please share them with me.
Hi Toan,
I must say, you are doing a great job.
I have one doubt below calculation, it would be great if you spend some time to explain me.
(WINDOW_MAX(MAX([Path]))/(WINDOW_MAX([Index])))*
(((WINDOW_MAX([Index]))-1))/(WINDOW_MAX([Index]))
Toan has automated the process of finding the angle so the distance between the dots remains Constant.This is really a great Example of Clever Coding. In simple words, whatever the angle which you are getting , Toan is only taking 96% of the Number.
As you can see,there are 25 marks in a circle because the size of the Bins = 15
WINDOW_MAX(MAX([Path]))= 361
(WINDOW_MAX([Index])) = 24
((WINDOW_MAX([Index]))-1))=23
So when you calculate the angle would be (361/24)*96% = 14.41 In a nutshell, the distance between each circle will always be 15 degree. Hope this make sense. Please correct me if my understanding is wrong @Toan
You explained it in a nice way.Thanks Rajeev
Hi Toan – great tutorial again which I have managed to recreate but did come across a problem at the stage where you remove all objects from the Sum(Zero) Mark Panel. When I did this the text disappeared and there was a null indicator on the chart. To show the text I had to click this indicator and select “show data at default position”. It then worked fine. Just had to change to Max to show correct value.
Just wondering how this would work with more rows of data – has anyone replicated this technique with another data set?
Thanks for this spot, there was text in the blog, but for some reason, it disappeared so readded now.