
I am not the biggest fan of using floating shapes and, if possible, like to create all my data visualisations through drawing polygons. However, a lot of people on my Facebook Group has requested a tutorial on how to create extremely bespoke filled shapes in Tableau. As such, we are going to look at a fun way of creating images and overlaying them on top of a bar chart in Tableau to create the filled shape effect.
Note: This is just for fun, and I do not advocate using this technique for client work unless you have a really good use case for it. However, when having fun on Tableau Public, then why not give this a try.
GIMP

GIMP (/ɡɪmp/ GHIMP; GNU Image Manipulation Program) is a free and open-source raster graphics editor used for image retouching and editing, free-form drawing, converting between different image formats, and more specialized tasks. GIMP is released under GPLv3+ licenses and is available for Linux, macOS, and Microsoft Windows.
I do like using Adobe Photoshop for my image editing but these days I use GIMP a lot more, so in this tutorial, we are going to have fun with GIMP. If you have not used GIMP before, I would suggest you downloading this and giving it a try.
GIMP Website: https://www.gimp.org
GIMP Documentation: https://www.gimp.org/docs
Tableau
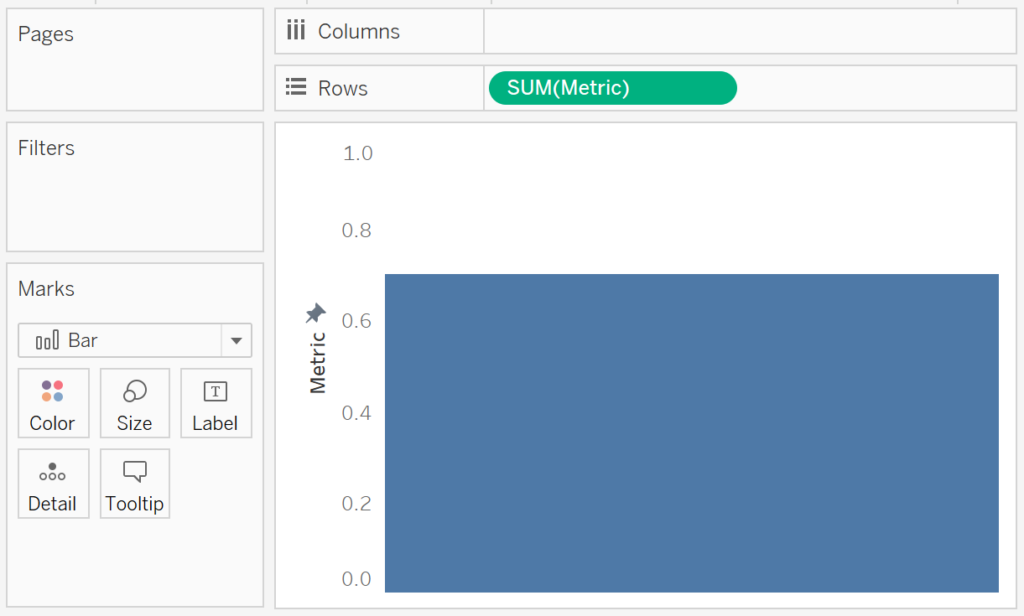
Let us get started in the simplest way possible, and that is by building a simple worksheet that displays a bar chart. Let us start by loading the following data into Tableau Public / Desktop.
Metric
0.7
and to create the following worksheet:
- Change the Mark Type to Bar.
- Drag Metric onto Rows.
- Double-click the Metric Axis.
- Set Range to Fixed.
- Set Fixed Start to 0.
- Set Fixed End to 1.
You should see the following:

Exciting, I know, but let us:
- Remove all Grid Lines
- Remove Zero Lines
- Hide the Header
- Create a New Dashboard
- Drag this worksheet onto the Dashboard.
- Set the x position to 50.
- Set the y position to 50.
- Set the Width to 400.
- Set the Height to 400.
I know this is not very exciting, but we have basically created a blue block on a dashboard. We will get back to this in a bit, but this is where the fun is going to start.
Creating your Overlay
We will now use GIMP to create a transparent image which we will overlay on top of this visualisation.
Note: I could have used other tools, but as we are going to be working more and more with Graphic Design in our Tableau roles, we may as well have a little play of this now.
- Start GIMP.
- In the Menu, go to File and select New…
- In the Create a New Image window
- Set Width to 400.
- Set Height to 400.
- Click OK.
- This will create our image.
- In the Create a New Image window
There are a few things that we will need to look into:
- Set the Background Color.
- Set the Foreground Color to White.
- Hover over the icons in the top Left-Hand corner of the window to see the tooltips, and select the Bucket Fill Tool.
- Use the Bucket Fill Tool to ensure that your canvas is White.
With our canvas prepared, we are going to create a single letter, yep, we are going to start off with something simple.
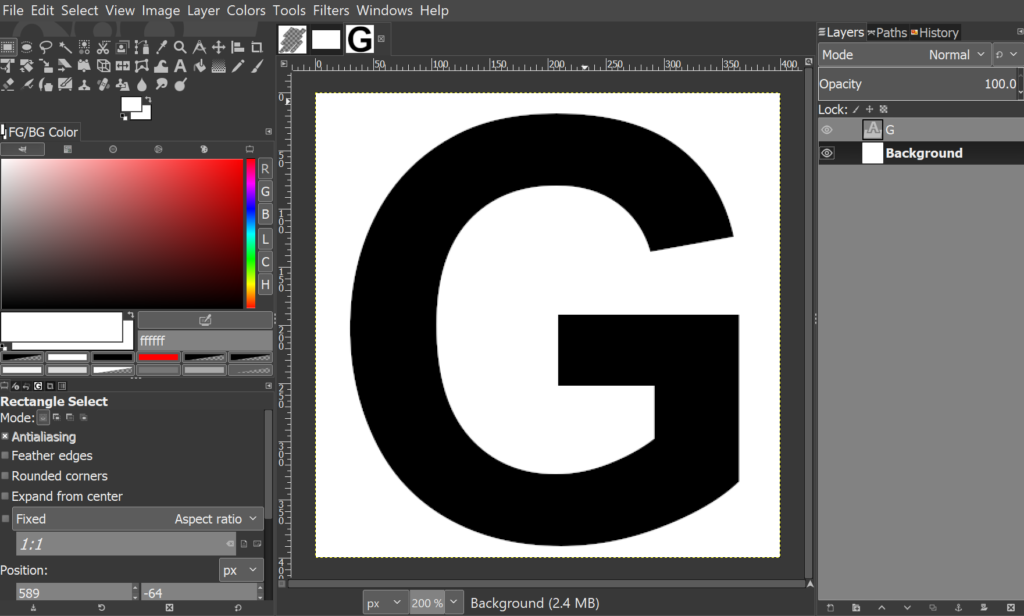
- Now set the Foreground Color to Black.
- Using the Text Tool draw the letter G, in black, in the middle of the canvas.
- Note: I used Arial Bold and Font Size of 500.
You want to have something like the following:
In the Layers window on the right, right-click on an empty space (below the Background layer) and select Merge Visible Layers to combine the G Layer with your Background Layer to create a single image.
With a single image layer created, we will delete the Black Letter:
- Using the Select by Color Tool (hover until you find the right tool).
- Set the Feather Edges Radius to 10.
- Note: we set this value to 10 to allow for a dark outline.
- Click on the black letter; this will select everything black on your image.
- With the G selected, click delete to remove the black colour from the image.
- Set the Feather Edges Radius to 10.
You should now have the following image:

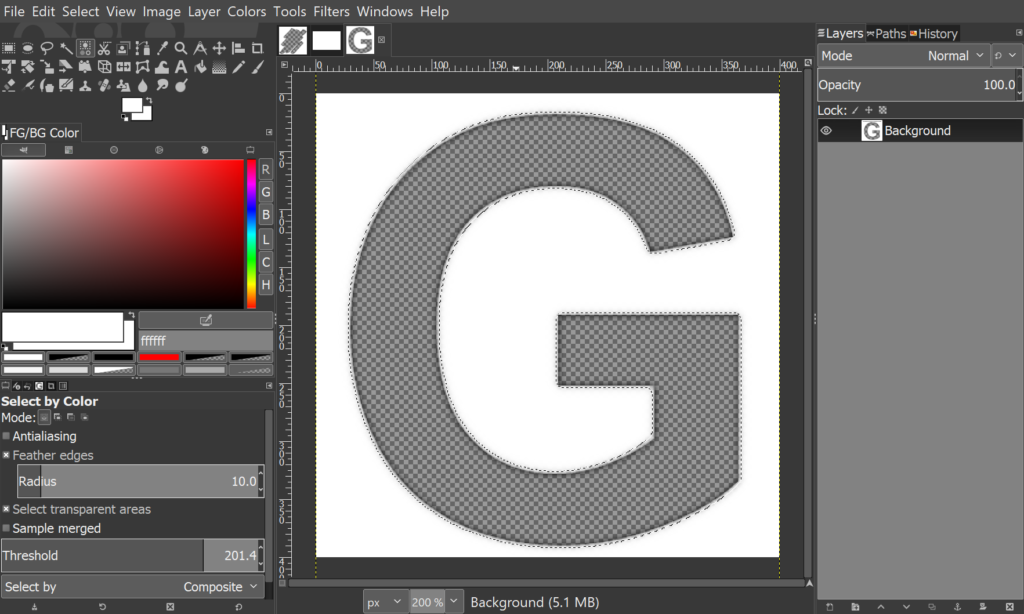
Note: the checkered background represents the transparent part of the image.
In Menu, go to File and select Export As, give your file and name and select Export.
Overlaying your Image
So now, we will go back to your Tableau Dashboard.
- Selected Floating.
- Drag Image onto your Dashboard and select your G image.
- Set the x position to 50.
- Set the y position to 50.
- Set the Width to 400.
- Set the Height to 400.
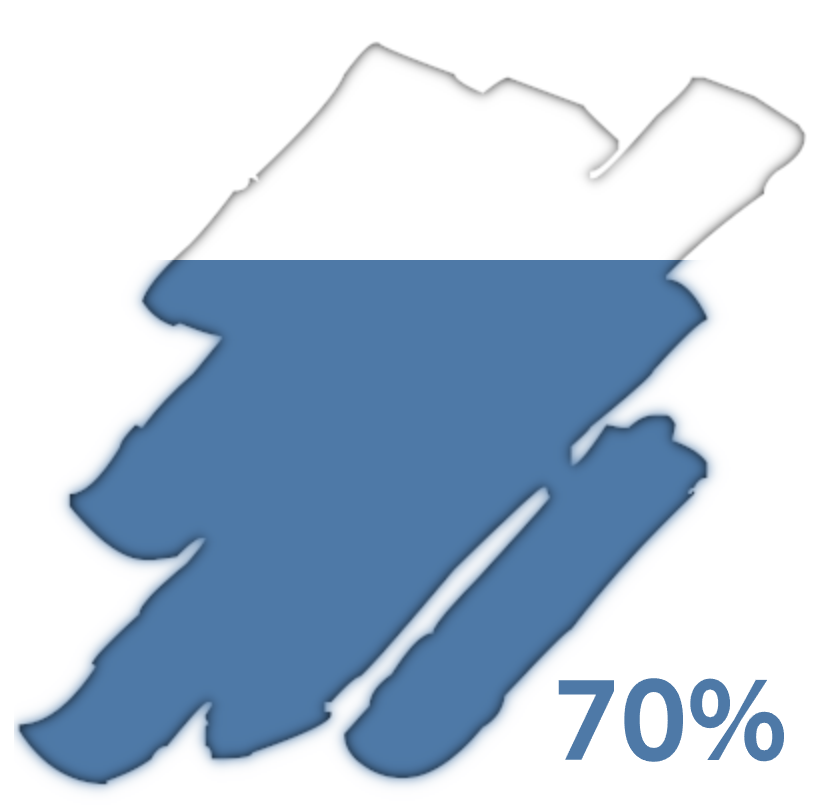
You should end up with the following:


Now, let us have more fun and try different letters or words:


or, if you really want to have a laugh, download and install the Under Font (here) and give this a try.

Summary
I hope you all enjoyed this article as much as I enjoyed writing it and as always do share the love. Do let me know if you experienced any issues recreating this Visualisation, and as always, please leave a comment below or reach out to me on Twitter @Tableau_Magic.
If you like our work, do consider supporting us on Patreon, and for supporting us, we will give you early access to tutorials, exclusive videos, as well as access to current and future courses on Udemy:
- Patreon: https://www.patreon.com/tableaumagic
Also, do be sure to check out our various courses:
- Creating Bespoke Data Visualizations (Udemy)
- Introduction to Tableau (Online Instructor-Led)
- Advanced Calculations (Online Instructor-Led)
- Creating Bespoke Data Visualizations (Online Instructor-Led)