


")


Data Visualization Labs Path CEO & CVO
Tableau Zen Master
The Head of JapanTUG
Twitter: @DataVizLabsPath
Website: https://www.datavisualizationlabspath.com
Yukari Nagata, 永田ゆかり, Tokyo, joined the Zen Master class of 2019. Yukari is currently the head of the Japan Tableau User Group and the Japan Visual Analytics User Group. Yukari specialises in data visualisation, data analytics and design-thinking and she is passionate about connecting business with data.
Given that Japan is still exploring the concepts of data culture and data literacy, Yukari is passionate about training, mentoring and helping users unlock insights within their data.
I had the privilege of having a conversation with Yukari about her experiences and journey in data and Tableau.
A Japanese version of this conversation can be found here:
https://note.mu/datavizlabspath
Toan: Tell me a little about your background, how did you get into data visualisation and Tableau?
Yukari: At University, my major was economics and I did not have experience in data or data visualisation until recently. Having experience in global consulting firms like Accenture or KPMG, I met Tableau in an EC company in Japan between consulting firms. That was the first time I got exposure to Business Intelligence, Data and Tableau; the Tableau experience was sensational for me as the tool is very flexible, sexy and really beautiful.
After which, and very recently, I established my own company for data visualisation and analytics in Japan. Today, I am Founder, CEO and CVO (Chief Visualization Officer) of Data Visualization Labs Path and a special advisor in KPMG FAS for data analytics.
In organisations, gaps or disconnections naturally happens if we do not take conscious care. What commonly happens is a disconnection between the business side (sales, planning and marketing) and the product side (engineering, development). In the data field, this gap is really big and I am sure we can maximize the value of data, so I would like to be the one who understands both, and I named this “path”.
I am also the head of Japan Tableau User group and was surprised to be announced as Zen Master in 2019.
Toan: Starting your own data analytics and data visualization company sounds both interesting and challenging. How did this come about? What was your thinking process behind making this happen? More interestingly, where do you see things going?
Yukari: Prior to starting my own company, and fortunately, I was receiving a lot of requests for analytics and visualisation assistance; around autumn last year, these requests were increasing at a crazy rate. Simply, that is why I decided to start an independent business. So, looking back, my thinking process was very simple! (LOL).
This did not come about because I am smart or excellent, but because there are very few people who get used to the concept of data visualization/analytics, who can translate the issues with data from the business issues, and who are accustomed to using Tableau. Tableau is a good tool, but there is a difference between using the tool and finding the most effective way of creating calculations and selecting the most appropriate and performant visualisations and obtain actionable insights. In this respect, this thought leadership and additional skill sets are in high demand because it will take time and be costly to train and educate people.
I understand there is a huge gap in data literacy and maturity between Japan and the UK, US or other data-developed countries; Japanese companies are still babies compared to other countries like the UK. Japanese companies have not reached the level of maturity where you have visualisations of key business metrics, but this is a journey.
Though most companies try to implement complicated analytical tool or technology, I believe that companies must have simple visualisations to meet their needs and highlight new insights before diving into complicated analytics. Data visualisations can have a huge impact on organisations, so I am sure that they are becoming more prioritised.
Toan: Chief Visualization Officer, that is the first time I have heard that term, and it is wonderful. I remember seeing CDO followed by CDSO, but what do you think the role of a CVO would be? Do you see this role appearing more and more? What do you think the main challenges of a CVO?
Yukari: I coined this because there is no such term. LOL
Because visualisation itself has depth, just like other fields, I thought the granularity of Chief Data Officer (CDO) cannot cover everything; data is way too high level of granularity and it is difficult to talk about practical things. The reason why I coined CVO, is because I believe that we should establish such experts independently and to work alongside the CDO; some CDOs are not well versed in data visualisation and the consequence of this can be huge. This is why I would like to establish this concept more and more in Japan.
The concepts of User Interface (UI) and User Experience (UX) is growing in Japan, however, I decided to focus on data-oriented visualisation, not just UI and UX; of course, data visualisation itself is a subset of UI and UX.
Toan: What would you say to people who may want to be one in the future?
Yukari: Data visualisation is about changing people and society, improving data literacy, and it is exciting to solve real problems from real data, and using visualizations. It would be awesome to get involved in this movement. The important thing is to have a flexible mindset to relive the assumption or belief.
Toan: You are a very busy person, and congrats on becoming a Zen Master, this is a great achievement. Has anything changed since becoming a Zen Master? Are you even more motivated now? Are you going to do even more?
Yukari: I am honoured to become a Zen Master, however, and truthfully, I cannot understand the reason why I was selected (lol)
Being a Zen Master is like being from a different world as the other Zen Masters are people whom I have admired for a long time and I always learn from them, especially the likes of Andy, Mike, Klaus, Bridget, Chris, Ken, Adam, Luke and Ryan. They are like godlike being. Then it is unbelievable for me to be one of the fantastic members.
On reflecting, I think it is because I have contributed a lot to Tableau User Community as the head of Japan Tableau User Group and I am the coach of Visual Analytics in Japan; this is a both personally rewarding as well as a volunteer activity.
For your reference:
- Japan TUG introduction:
- Visual Analytics Session (Sorry this is all Japanese though).
https://public.tableau.com/profile/yukari.nagata0623#!/vizhome/1218-YukariNagata/sheet0
I am so surprised that this material’s view reached over 4000 views in one night. I think it means that data visualisation and analytics material does not exist in Japan when compared to the US or UK.
Something that changed since becoming a Zen Master is that people around me, especially people who have not been interested in data, visualization and analytics so far, increased their interests in data visualisation, analytics and Tableau; I am so glad to see this change.
Toan: Tell us how it felt when you were informed of the results?
Yukari: It was unbelievable. I have always been inspired by other Zen Masters and learned a lot from them and, of course, you as well. I know their skill and big contributions to the community is a different level from my own. I do feel that the selection process of Tableau Zen Master is a mystery! LOL.
However, I think I really studied and practised much more than others because I didn’t know anything about it with a liberal arts background. (lol)
Toan: What type of work inspires you in Tableau, and why?
Yukari: Business due diligence and financial due diligence work always inspires me and feels rewarding because Advisory like M&A has many aspects (functions) of businesses, including sales, human resources, finance, tax and others. It is interesting we should need to aggregate together with different components. I feel so inspired due to the different data types and strategies which are unique to each deal.
Toan: I have not actually worked for Advisory, what are the types of work, without giving client specifics, have you worked on? What types of visualisations do you generally build? When I think Advisory, I think big tables and spreadsheets, how do you use Tableau here?
Yukari: There are various types of work at Advisory. Sometimes it is just a simple trade area analysis, sometimes web marketing and sometimes big data analysis for POS transaction data. Sometimes we do forensic. It is so variable depending on how we would like to focus on.
Let me give you a concrete example:
- Fraud transaction analysis and forensic analysis.
- Specific Account Analysis like the entertainment expense, expat expense and traffic expense.
- Analytics of unaccounted money.
- People Analytics like Employee NPS and Engagement Survey analysis.
- People assignment optimization.
- Blockchain Visualization.
My field looks various and you may think “no expertise” when giving expression with “words” but data takes the old-fashioned “expertise concept” wall all off. Business and society always link together sterically.
Data exists differently from the world we are shaping in an arbitrary manner. Most people misunderstand that data, exists as is the case with the world, you see, or your shape.
Toan: Very interesting, what were the most challenging aspects of the work you have done in Tableau?
Yukari: I feel that all the projects I have done so far have been rewarding rather than “challenging”.
However, as you know data prep and planning the strategy of data prep takes a lot of time, but it seems difficult for some people to understand it. This is a challenging point for communication.
People come from various backgrounds.
Firstly, data management is not matured yet in Japan, we do not always have the data for what they want to achieve, and normally there is no beautiful data well-aligned. So, preparation and understanding are critical.
Toan: What do you use to prepare your data? Do you do preparation in Databases, Alteryx, Tableau Prep, or other tools?
Yukari: Sometimes, I do data preparation in Tableau Prep if it works in terms of performance, however, depending on the situation and client, I have used Google BigQuery and Treasure data.
Toan: What are your thoughts on self-service data prep? Where do you think the field of data preparation will go?
Yukari: We say Garbage-in, Garbage-out when we talk about the quality of data. In Japan, I have never met a good quality of data. If I say about the quality of data, it is all low so there is no scale of high or low.
Self-service data prep is good, and the development of the concept is good; this allows us to solve many issues from our PC as opposed to connecting to Python or a database. Self-Service Data Prep makes managing data very convenient.
In my opinion, everything (not only the data prep feature) is going to become viewer-oriented, and for those who are not advanced with data. If we think of data-literacy levels as a pyramid, the biggest zone, at the bottom, is the viewer-layer.
We tend to have technical discussions with advanced people, but when we think about it, the person who has the largest impact to the organization and society may be the viewer-layer, so it is inevitable to consider this when developing comprehensive features like data prep.
Toan: Tableau is amazing, where do you see Tableau going in the next few years. What features would you love to see, or functionality improved upon? If you were the CEO of Tableau, what would you see as key?
Yukari: In the next few years, I would like to see Tableau focus on the features for “viewers” rather than “creators” because the viewer-layer is the largest part of any company as I said earlier.
Natural Language Processing (NLP), Natural Language Querying (NLQ), and something related to deep learning seems a key factor because it enhances viewer-oriented functions, unconsciously, for the person who is not advanced with data.
In Japan, the fusion with AI and BI is now finally emerging but, currently, few companies can utilise the potential of both due to the lack of data and lack of literacy.
I expect the key to success is how easily these new features and functionalities can be deployed across an organization.
Toan: For those who do not know, AskData was released in 2019.1 and should be enhanced over the next few releases. I would love to see AskData be activated by voice, which I am sure is coming, but what are the key features that you would love to see Tableau implement in NLP? More importantly, how do you think this will impact the way people use Tableau?
Yukari: I think NLP is also the feature that will play a larger role in the viewer-layer. I believe that there are a lot of people in the world who do not know data and the ability to work with data without conscious expertise is wonderful.
This is like water. We drink water from the tap without thinking about where it came from. But a long time ago, we drank water inevitably by pumping water from a well; the same thing will happen in the data world.
I believe that more and more features will be released over time and, like water, can be used without conscious expertise in the handling of data.
Yes, your idea of voice activation is like the above! This feature can be used without conscious expertise.
Toan: Where do you see AI and BI working together? Do you see more AI appearing in the reporting tools like Tableau? Or do you see more AI being performed in databases? What do you think about AI in general, what excites you about this field?
Yukari: I see this split into two journeys:
One is the real-time linkage with analytics and AI:
Data → BI dashboard ⇆ Algorithms (e.g. to forecast and prophesise)
And the other one is to embed in an analytical process:
Data → Algorithms (e.g. Light GBM) ⇆ BI Dashboard
What excites me is to collaborate with AI (machine-learning) and BI (Visualisation in Tableau); I often work and collaborate with machine-learning engineers when designing my visualisation and dashboard.
For example,
- Using AI to predict potential turnover rates for the companies who are bothered by high turnover.
- Using AI for fraud transaction detection by text-mining.
AI can contribute a lot to a project by working together.
Toan: Tableau has an amazing community for learning and there are loads of places to go. What is your top tip for really excelling within Tableau, what is your secret?
Yukari: Uhmm… I don’t have any secret tips.. if I am forced to say, ah! my secret is to keep going. Most people do not keep going, so seriously, just keep going, persistence is the big secret to becoming a top Tableau user!
In addition to the above, I have highlighted several critical factors to enhance your skill in data visualisation and analytics. Working in data is not only about data.
- Proficiency in tools (Tableau).
- Visualisation experience/knowledge.
- UI Design.
- Data-Storytelling.
- Calculation, Function.
- Statistics experience and knowledge (including R).
- Data prep (including SQL, Python).
- Business domain knowledge/experience.
- The Skill of Clarifying task.
- Joke, sly, fun.
What you do in Tableau is the aggregation of above all.
Toan: It is something that I have noticed over the years, a lot of people start with loads of enthusiasm and energy, and then that energy slowly disappears until they are gone. What are your tips for keeping your energy? How do you stay motivated and passionate? How do you keep things fresh?
Yukari: The thing is not to do what I am not motivated by. So, I do not try to keep motivated “intentionally”, basically, there I don’t think I can offer tips to stay motivated and passionate! LOL.
The thing is that there are many people who really love what they do, so you need to be trying to make an effort. In the wake of this point, you cannot compete with people who are naturally motivated and passionate.
So, if you are losing motivation, it might be a sign to stop what you are doing, trying it a different way, or it could mean that it does not fit to your personality or competency. It is not a bad thing.
For me, motivation and passion are the comprehensive signals to judge whether you continue or stop; in life, the challenge is to find what you like and do it.
In Tableau, there are a lot of things to learn, and I always find new things, and, I am always inspired by other people in the world. I have never felt bored.
Toan: Where do you get your inspiration in the Data Visualisation space? Who inspires you and which blogs, resources or people do you follow?
Yukari: Tableau Public is a great place to be inspired. I also read blogs and Twitter posts. My favourites people are:
- Andy Cotgreave http://gravyanecdote.com/
- Andy Kriebel http://www.vizwiz.com/
- Ryan Sleeper https://www.ryansleeper.com/
- David Murphy https://datasaurus-rex.com
- Ken Flerlage https://www.kevinflerlage.com
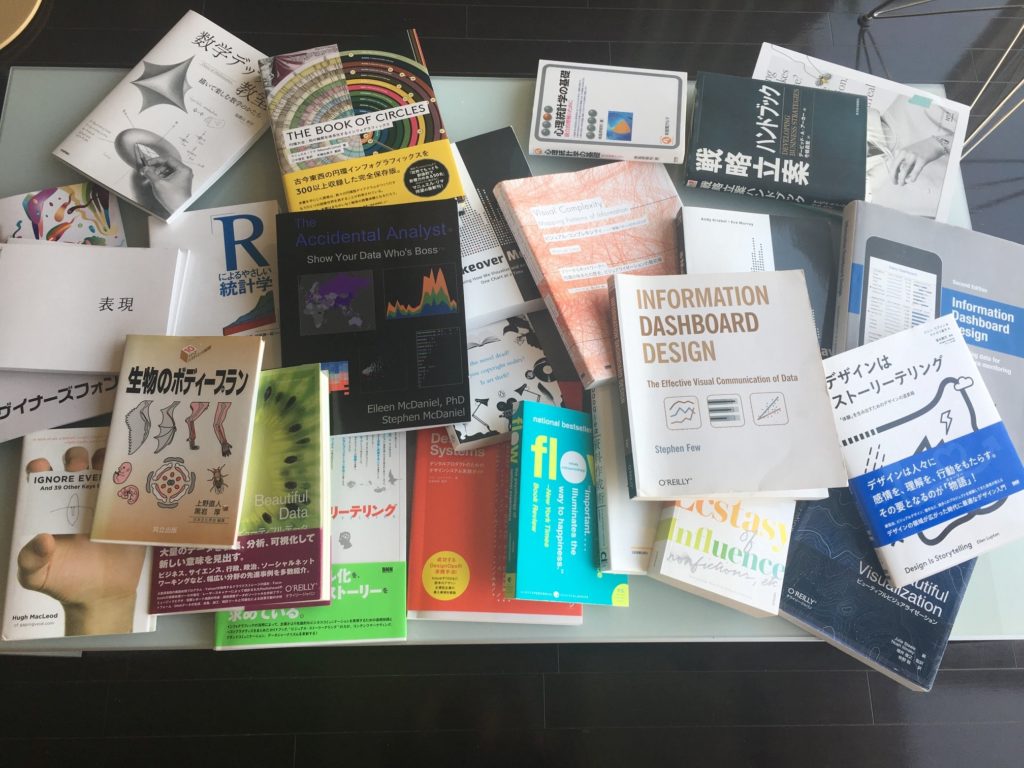
And this is an example of my reading material (about a third of my collection since I have kindle material too!).
Toan: Lastly, I would like to know something personal about you, as much as you are comfortable sharing, it would be amazing for people to know you as a person.
Yukari: I am a foodie (especially wine), beauty, aesthetics and makeup! I love good food in the world. When I travel, I base my trip on food and aesthetic activities! I gained 3kg from good food and lose weight of 1kg from esthetic(lol). Apart from that, I am a typical normal girl, except for my passion in Tableau. LOL.
Toan: Thank you for having this conversation with me…
Data Visualization Labs Path CEO & CVO
Tableau Zen Master
The Head of JapanTUG
Twitter: @DataVizLabsPath
Website: https://www.datavisualizationlabspath.com
A Conversation with Season 1:
- Episode 1 / Mark Bradbourne
- Episode 2 / Josh Tapley
- Episode 3 / Lindsay Betzendahl
- Episode 4 / David Pires
- Episode 5 / Dilyana Bossenz
- Episode 6 / Yukari Nagata
- Episode 7 / Emily Kund
- Episode 8 / Ken Flerlage
- Episode 9 / Sarah Burnett
- Episode 10 / Merlijn Buit


 Expressions")


")