When I started to learn Tableau, I remember being completely amazed and confused about how to build Bora Beran’s blog on Sunbursts; I could not believe that this was possible in Tableau and I wished that I could build it one day. In this blog, I am going to go through the building of a Sunburst visualisation in Tableau. Bora Beran’s blog can be found here:
https://boraberan.wordpress.com/2014/12/31/radial-treemaps-bar-charts-in-tableau
The Data
Let us get started by downloading the data source and open it in Tableau. Download the data source: HERE
Calculated Fields
We will create a Path (bin) object by:
- Right click on Path
- Go to Create, Bins…
- In Edit [Path] set the Size of bins to 1
- Click Ok

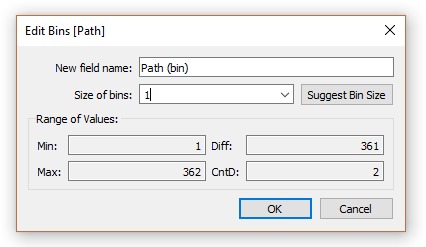
The Path (bin) will allow us to use a table calculation to create additional data points between 1 and 362.
Note: we are using the Path (bin) to densificate data and give us more points to work with. One thing to make sure of is that you check the Show Missing Values.
We will now create the following Calculated fields.
Index: This Table Calculation will be used to represent the individual points.
(INDEX()-1)*2WC_PI: A Table Calculation that represents PI.
WINDOW_MAX(MAX(PI()))WC_Value: This gives you the value of the individual segments.
WINDOW_MAX(MAX([Value]))*2WC_Max Distance: This gives you the maximum distance away from the centre point.
WINDOW_MAX(MAX([Distance]))WC_Min Distance: This gives you the minimum distance away from the centre point.
WINDOW_MIN(MIN([Distance]))Note: These are needed to draw the individual segments
WC_Starting Point: This will be used to identify where each segment starts.
RUNNING_SUM([WC_Value])-[WC_Value]X: This is used to draw the X points
IF [Index] < 362 THEN
   SIN((([Index]*[WC_Value])+([WC_Starting Point]*360))*[WC_PI]/360)*[WC_Min Distance]
ELSE
   SIN((((722-[Index])*[WC_Value])+([WC_Starting Point]*360))*[WC_PI]/360)*[WC_Max Distance]
ENDY: This is used to draw the X points
IF [Index] < 362 THEN
   COS((([Index]*[WC_Value])+([WC_Starting Point]*360))*[WC_PI]/360)*[WC_Min Distance]
ELSE
   COS((((722-[Index])*[WC_Value])+([WC_Starting Point]*360))*[WC_PI]/360)*[WC_Max Distance]
END
Now that we have all the Calculated fields, we will now go about building our worksheet.
The Worksheet
Let’s start by dragging our Calculated fields onto the worksheet:
- Grad Path (Bin) onto the Details Mark.
- Drag X onto Columns
- Right click on X, select Compute Using and choose Path (Bin)
- Drag Y onto Rows
- Right click on Y, select Compute Using and choose Path (Bin)
- Change the Mark Type to Polygon
- Drag Index onto Path
- Right click on Index, select Compute Using and choose Path (Bin)
- Drag Label onto the Color Mark
You should now see the following:

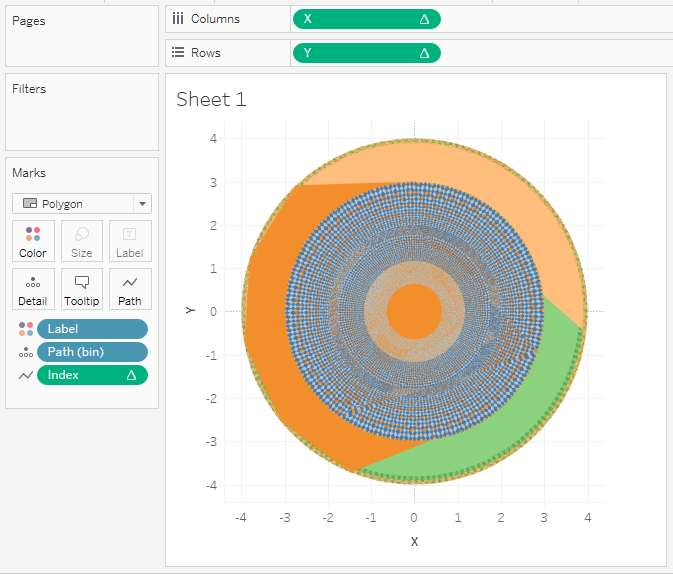
Seriously, do not panic, we will work this all out.
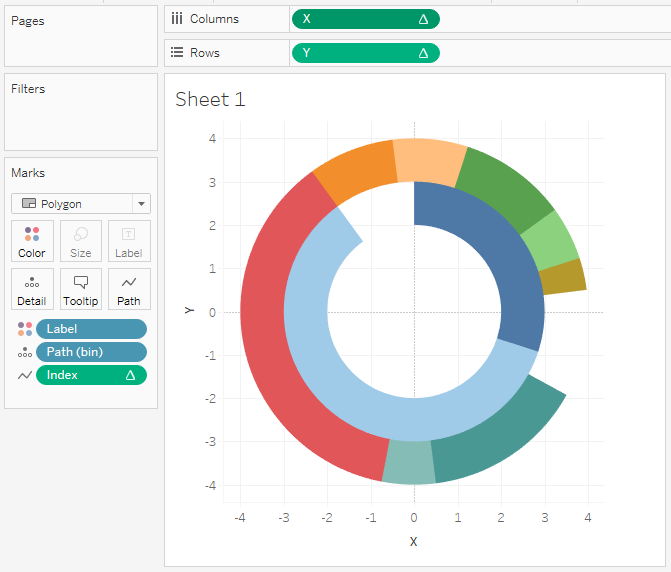
- Right click on X and click Edit Table Calculations
- For WC_Value select Specific Dimensions
- Tick Label
- Tick Path (bin)
- Make sure Label is on top
- In Restarting every, select Label
- For WC_Min Distance select Specific Dimensions
- Tick Label
- Tick Path (bin)
- Make sure Label is on top
- In Restarting every, select Label
- For WC_Max Distance select Specific Dimensions
- Tick Label
- Tick Path (bin)
- Make sure Label is on top
- In Restarting every, select Label
- For WC_Starting Point select Specific Dimensions
- Tick Label
- For WC_Value select Specific Dimensions
- Right click on Y and click Edit Table Calculations
- For WC_Value select Specific Dimensions
- Tick Label
- Tick Path (bin)
- Make sure Label is on top
- In Restarting every, select Label
- For WC_Min Distance select Specific Dimensions
- Tick Label
- Tick Path (bin)
- Make sure Label is on top
- In Restarting every, select Label
- For WC_Max Distance select Specific Dimensions
- Tick Label
- Tick Path (bin)
- Make sure Label is on top
- In Restarting every, select Label
- For WC_Starting Point select Specific Dimensions
- Tick Label
- For WC_Value select Specific Dimensions
Do not panic while making these changes, but once you are done, you should get the following:

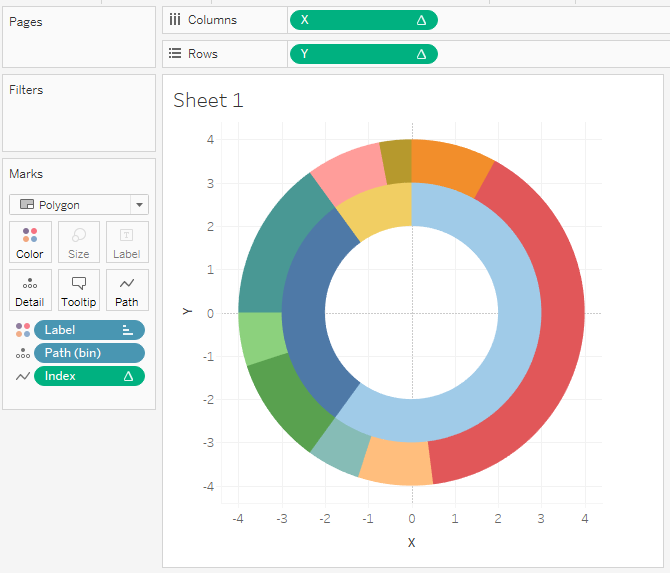
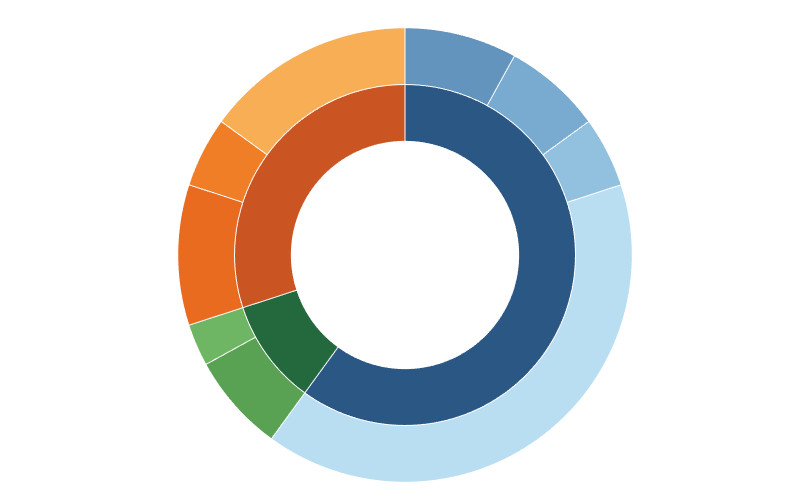
You can see it all coming together. What we need to do next is sort our Labels. Right click on Label and manual sort to this order:
- Europe
- Asia Pacific
- North America
- France
- United Kingdom
- Germany
- Spain
- Hong Kong
- Japan
- Singapore
- United States
- Mexico
You will now have the following:

Now, by yourself:
- Remove the axis headers, Gridlines and zero lines
- Modify the colours and add white border lines
- Add tooltips
You should now have the following:

For extra credit:
- Add this worksheet to a Dashboard
- Create another sheet which shows the Label and Value Label, add this to the Dashboard and position in the centre of the Sunburst.
- Use Dashboard actions to make sure that when you click on the Sunburst, the centre worksheet will filter to show details.
You can find my visualisation on Tableau Public at https://public.tableau.com/profile/toan.hoang#!/vizhome/Sunbursts_1/Sunbursts
Summary
I hope you enjoyed following this blog and, as always, let me know your comments below, or on Twitter at @Tableau_Magic.
If you like our work, do consider supporting us on Patreon, and for supporting us, we will give you early access to tutorials, exclusive videos, as well as access to current and future courses on Udemy:
- Patreon: https://www.patreon.com/tableaumagic
Also, do be sure to check out our various courses:
- Creating Bespoke Data Visualizations (Udemy)
- Introduction to Tableau (Online Instructor-Led)
- Advanced Calculations (Online Instructor-Led)
- Creating Bespoke Data Visualizations (Online Instructor-Led)