


")


In the final tutorial in this introductory series, we will cover Level of Detail (LOD) expressions, the types of LOD expressions, and how to leverage them within your worksheets.
What is an LOD Expression ?
Prior to the addition of LOD expressions to Tableau, data fields are added to a view and then display as values or aggregated as required. As per our last tutorial, we also have the ability to perform Table Calculations which allows us to create fields which are based on the data within a particular view.
However, what if we want to perform a calculation and include a dimension into the calculation which is not a part of the view? How would we handle this? Or perhaps we want to perform a calculation on the items on display but not take into account a certain dimension, again, this could be challenging.
As such, Tableau Level of Detail (LOD) Expressions come in three particular flavours:
- FIXED expressions compute a value using the specified dimensions, without reference to the dimensions in the view.
- INCLUDE expressions compute values using the specified dimensions in addition to whatever dimensions are in the view.
- EXCLUDE expressions declare dimensions to omit from the view level of detail.
In th remainder of this tutorial, we will explore these three types of expressions and get a sense of when we can use these.
Data
To explore Level of Detail (LOD) Expressions, we will load the following data into Tableau Desktop / Public.
| Region | Country | City | Sales Item | Sales |
| Europe | United Kingdom | London | 1 | 801328 |
| Europe | United Kingdom | London | 2 | 922428 |
| Europe | United Kingdom | London | 3 | 408806 |
| Europe | United Kingdom | London | 4 | 146180 |
| Europe | Spain | Madrid | 1 | 782474 |
| Europe | Spain | Madrid | 2 | 87264 |
| Europe | Spain | Barcelona | 1 | 641962 |
| Europe | Spain | Barcelona | 2 | 981043 |
| Europe | Germany | Berlin | 1 | 351677 |
| Europe | Germany | Hamburg | 1 | 611941 |
| Europe | Germany | Munich | 1 | 280839 |
| Europe | Germany | Frankfurt | 1 | 60155 |
Using this simple data set, we will demonstrate FIXED, INCLUDE and EXCLUDE.
FIXED
With the data loaded into Tableau:
- Drag Region, Country and City onto Rows.
- Change the Mark Type to Text.
- Drag Sales onto Text. Leave the aggregation type as SUM.
You should see the following:
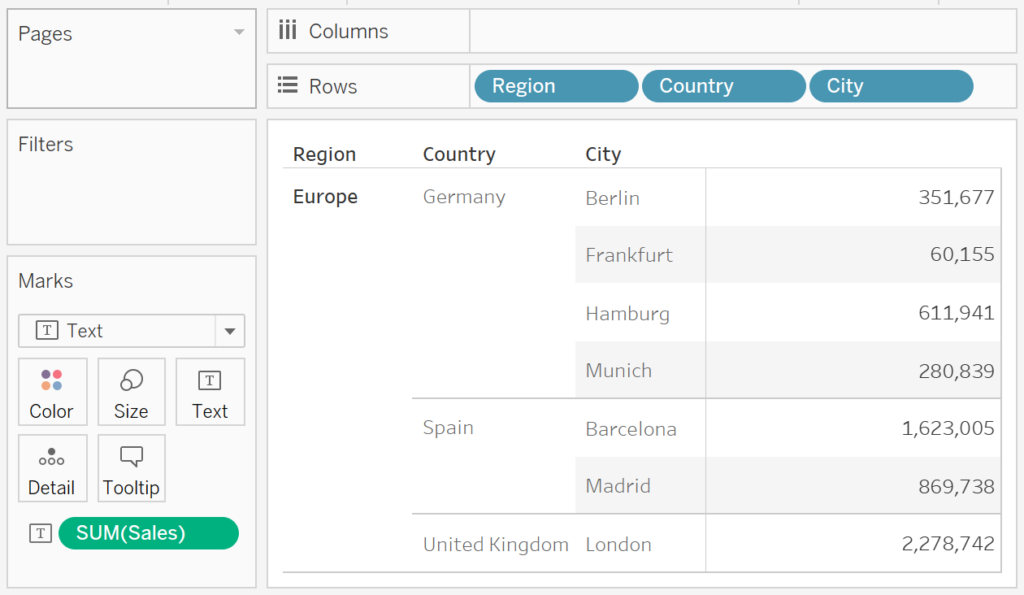
As you can see the SUM(Sales) is Calculated based on the Dimensions that are visible in the View. If we wanted to show the sum of Sales regardless of what is in the View, we can created a FIXED Level of Detail Expression. Create the following:
Total Sales
{ FIXED : SUM([Sales]) }Total Country Sales
{ FIXED [Country] : SUM([Sales]) }Now double click the Total Country Sales, and double click Total Global Sales. We should now see the following:
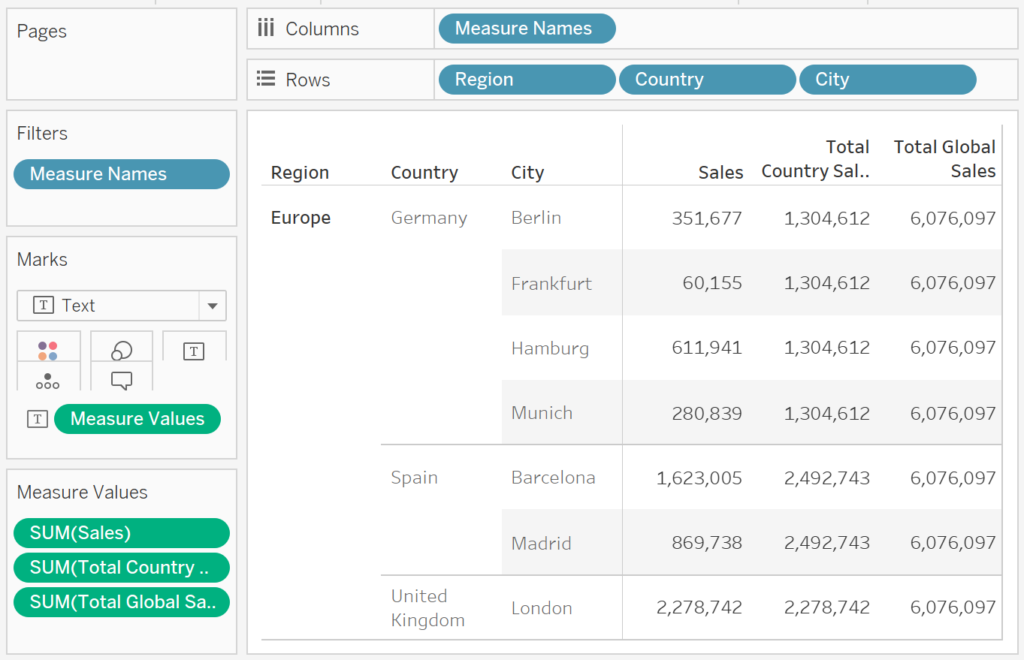
As you can see we have created LOD expressions where we define the level of detail of the Calculation regardless of what is in the current view.
INCLUDE
INCLUDE expressions can be useful when you want to calculate at a fine level of detail in the database and then re-aggregate and show at a more granular level of detail in your view. Fields based on INCLUDE level of detail expressions will change as you add or remove dimensions from the view.
Let us start off by creating the following Worksheet:
- Change the Mark Type to Bar.
- Drag Country onto Columns.
- Drag Sales onto Rows.
- Right-click on the object, go to Measure (SUM) and select AVG.
- Ctrl-drag this object onto Label.
You should now see the average Sales by Country.
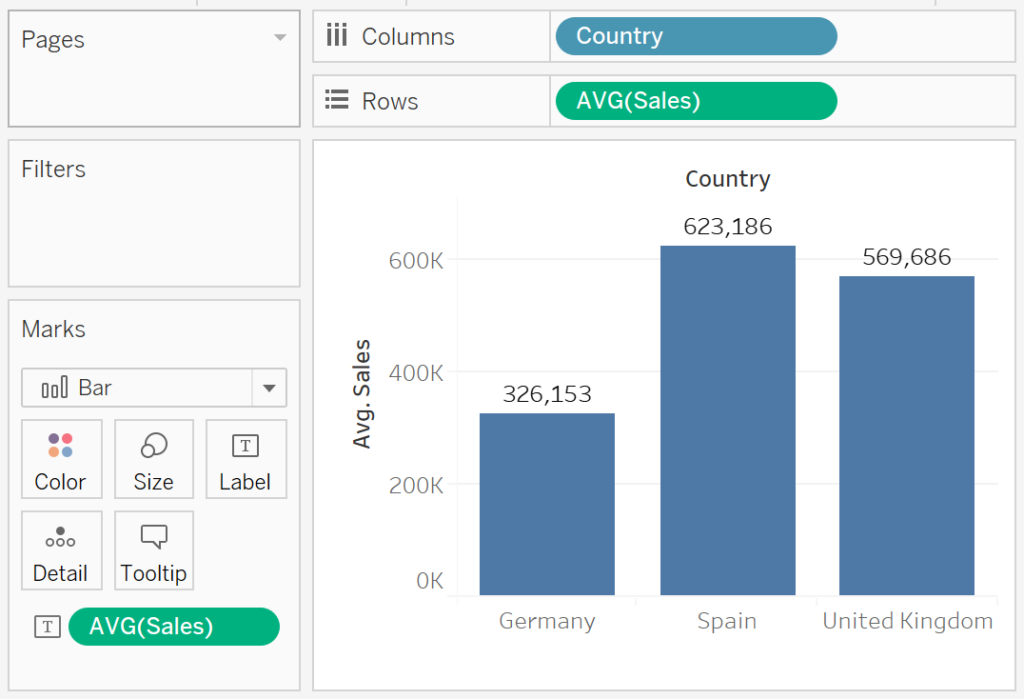
Image if we want to show the Average Sales by City by Country but do not want to show City, we will need to create an INCLUDE Level of Detail Expression:
Sales (include City)
{ INCLUDE [City] : SUM([Sales]) }Now let us add Sales (include City) onto Rows and set the type ot Average. Ensure that the Mark Shows AVG(Sales (include City)). You should now see.
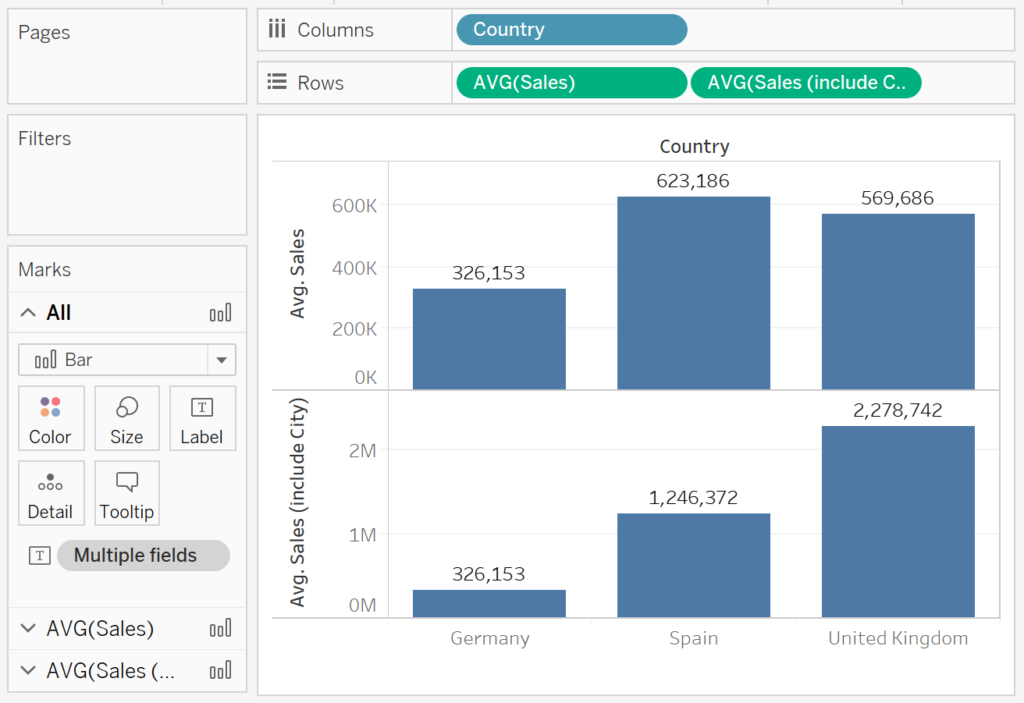
So what is this showing? Let us break down Spain for a moment.
- Average Sales for 782,474, 87,264, 641,962 and 981,043 gives us 623.186.
- This is shown in the top Bar Chart.
- Let us understand why the bottom Bar Chart.
- If we include City in our Calculation
- Sum of Madrid is 869,738.
- Sum of Barcelona is 1,623,005.
- The Average of these two cities is 1,246,372.
- If we include City in our Calculation
As you can see we have included City to the list of Dimensions in the current View calculations.
EXCLUDE
EXCLUDE level of detail expressions are useful for ‘percent of total’ or ‘difference from overall average’ scenarios. They are comparable to such features as Totals and Reference Lines.
EXCLUDE level of detail expression cannot be used in row-level expressions (where there are no dimensions to omit), but can be used to modify either a view level calculation or anything in between (that is, you can use an EXCLUDE calculation to remove dimension from some other level of detail expression).
Let us start off by creating the following worksheet:
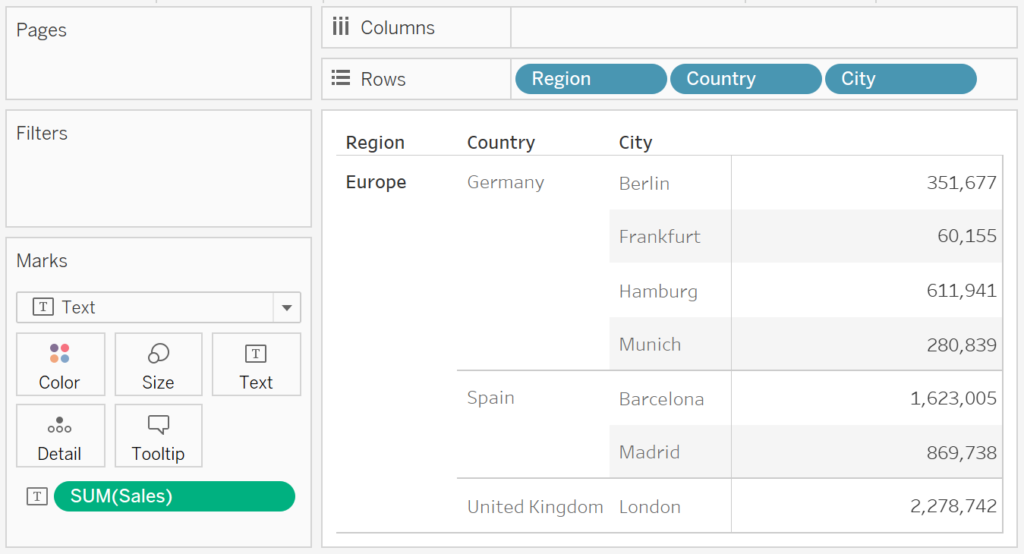
- Change the Mark Type to Text.
- Drag Region, Country and City onto Rows.
- Drag Sales onto Text. Leave the aggregation as SUM.
You should see the following:
Now imagine that we want to show the Sales in the current view, but exclude a certain Dimension? We will create the following EXCLUDE Level of Detail expression:
Sales (exclude City)
{ EXCLUDE [City] : SUM([Sales]) }Now double click this newly created Calculated Field to add this to the current view. You should now see the following:
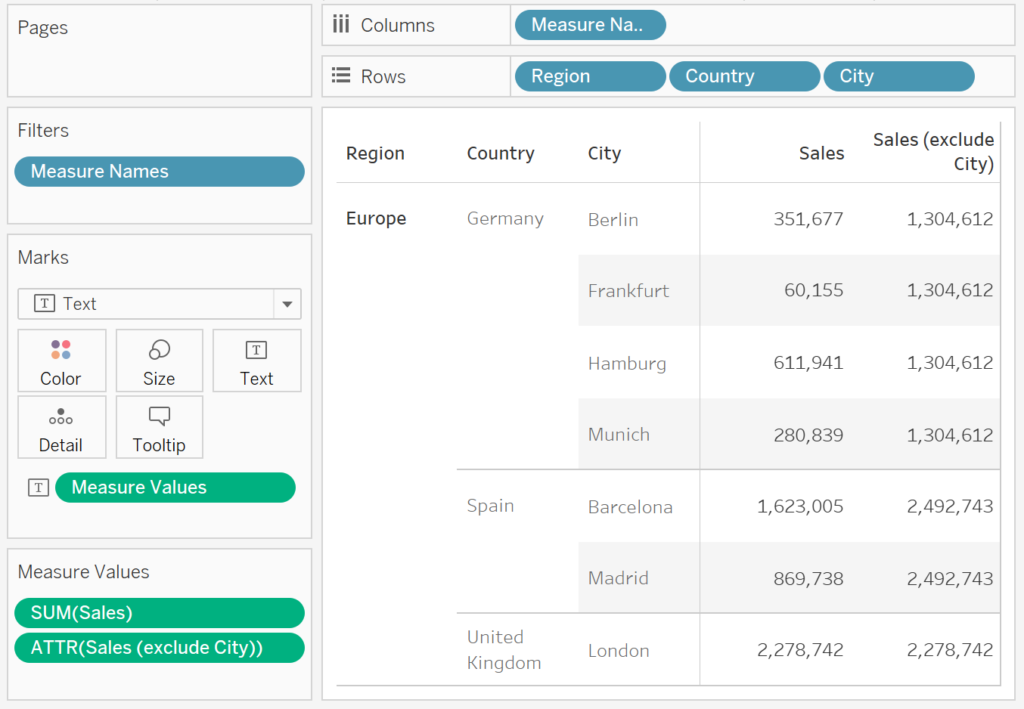
As you can see, we have created a Sum of Sales expression and exclude City from the list of Dimensions.
Considerations
Level of Detail (LOD) Expressions are very useful, but there are several things that should be considered:
Limitations
The following limitations and constraints apply for LOD expressions:
- Level of detail expressions that reference floating-point measures can behave unreliably when used in a view that requires comparison of the values; this is something to keep in mind when comparing values.
- Level of detail expressions are not shown on the Tableau Data Source page i.e. you cannot preview the LOD expressions.
- When referencing a parameter in a dimensionality declaration, always use the parameter name, and not the parameter value.
- With data blending, the linking field from the primary data source must be in the view before you can use a level of detail expression from the secondary data source; this can be quite a limitation.
In addition to these, some data sources have complexity limits and return query errors if calculations become too complex.
Aggregation and Level of Detail Expressions
The level of detail of the view determines the number of marks in your view. When you add a level of detail expression to the view, Tableau must reconcile two levels of detail; the one in the view (based on fields added), and the one in your LOD expression(s).
Experiment with LOD expressions and see what happens when you create an expression that returns data that is coarser or finer than the level of detail in your current view. This will allow you to better understand the behaviour of LOD expressions.
Level of Detail Expressions Can Be Dimensions or Measures
When you save a level of detail expression, Tableau adds it to either the Dimensions or the Measures area in the Data pane.
- A FIXED level of detail expressions can result in measures or dimensions, depending on the underlying field in the aggregate expression.
- INCLUDE and EXCLUDE level of detail expressions are always measures.
Filters and Level of Detail Expressions
- FIXED calculations are applied before dimension filters.
- INCLUDE and EXCLUDE level of detail expressions are considered after Dimension filters. So if you want filters to apply to your FIXED level of detail expression but don’t want to use Context Filters, consider rewriting them as INCLUDE or EXCLUDE expressions.
Summary
This was the final part in our introductory series, so I really hope that you enjoyed this series, and more importantly, feel ready to take on the big bad world of Tableau, seriously though, it is nice and warm here. I am always looking for ways to help share knowledge around the community, so if you want to know more about something, and wish there was a tutorial out there, do get in touch on Twitter at @Tableau_Magic.
For a full reference of Level of Detail (LOD) Expressions, check out the following links:
Here is a reminder of our previous articles in our series.
- Introduction to Tableau (TAB101).
- Installation of Tableau Desktop (TAB102).
- Data Sources and Connectivity (TAB103).
- Building Worksheets (TAB104).
- Exploring Marks (TAB105).
- Exploring Calculated Fields (TAB106).
- Exploring Filters (TAB107)
- Exploring Parameters (TAB108).
- Exploring Sets (TAB109).
- Building Dashboards (TAB110).
- Exploring Layouts (TAB111).
- Exploring Actions (TAB112).
- Advanced Calculations:
- Table Calculations (TAB113)
- Level of Details (LOD) (TAB114)


 Table Calculation")


Hi Hoang,
I came across various blog articles and found it very useful. Will you upload some articles on Tableau workbook deployment and security. Will be great to see.