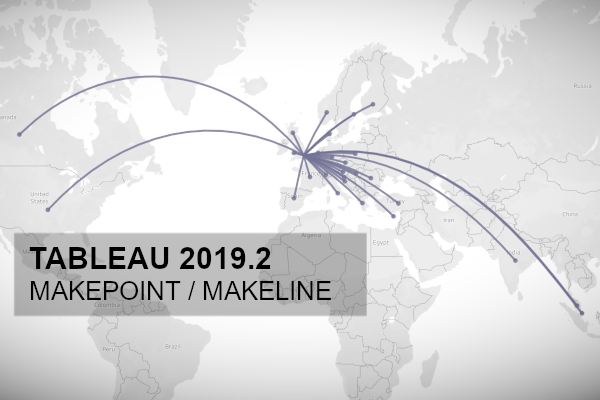
Tableau 2019.2 was released on Tuesday 21st May 2019 and comes with some very nice features. In this article, we are going to spend the next 10 minutes to look into the new MakePoint and MakeLine functions. I actually created a technique for creating an Arc Map in Tableau, and we are going to replicate this new awesome functionality.
Data
Load the following data into Tableau Desktop / Public.
From,From (Latitude),From (Longitude),To,To (Latitude),To (Longitude)
London,51.507351,-0.127758,Scotland,56.490669,-4.202646
London,51.507351,-0.127758,Wales,52.130661,-3.783712
London,51.507351,-0.127758,Spain,40.463669,-3.74922
London,51.507351,-0.127758,France,46.227638,2.213749
London,51.507351,-0.127758,Germany,51.165691,10.451526
London,51.507351,-0.127758,Belgium,50.503887,4.469936
London,51.507351,-0.127758,Netherlands,52.132633,5.291266
London,51.507351,-0.127758,Denmark,56.26392,9.501785
London,51.507351,-0.127758,Switzerland,46.818188,8.227512
London,51.507351,-0.127758,Italy,41.871941,12.56738
London,51.507351,-0.127758,Croatia,45.099998,15.2
London,51.507351,-0.127758,Slovenia,46.151241,14.995463
London,51.507351,-0.127758,Austria,47.516232,14.550072
London,51.507351,-0.127758,Czech Republic,49.817493,15.472962
London,51.507351,-0.127758,Poland,51.919437,19.145136
London,51.507351,-0.127758,Hungary,47.162495,19.503304
London,51.507351,-0.127758,Romania,45.943161,24.966761
London,51.507351,-0.127758,Greece,39.074207,21.824312
London,51.507351,-0.127758,Cyprus,35.126411,33.429859
London,51.507351,-0.127758,Turkey,38.963745,35.24332
London,51.507351,-0.127758,Finland,61.92411,25.748152
London,51.507351,-0.127758,Sweden,60.128162,18.643501
London,51.507351,-0.127758,Norway,60.472023,8.468946
London,51.507351,-0.127758,United States,37.09024,-95.712891
London,51.507351,-0.127758,Canada,56.130367,-106.346771
London,51.507351,-0.127758,Malaysia,4.210484,101.975769
London,51.507351,-0.127758,Singapore,1.352083,103.819839
London,51.507351,-0.127758,India,20.593683,78.962883
I am based in London and the following is a list of Countries that I have visited; I was actually surprised that the number is so low but I have been to multiple cities in each country. I am also adding South America and Africa to my to-do list.
Calculated Fields
We are going to start by creating the following Calculated Fields:
From Point
MAKEPOINT([From (Latitude)],[From (Longitude)])To Point
MAKEPOINT([To (Latitude)],[To (Longitude)])Note: The MAKEPOINT function takes in a Latitude and Longitude and create an object that represents a geographic point.
Path
MAKELINE([From Point], [To Point])Note: The MAKELINE function returns a line from two points.
MakePoint
We are now going to test our point Calculated Field; double-click on the To Point and you should see the following:
There are two points to note:
- Longitude (generated) and Latitude (generated) are added to the Columns and Rows.
- The COLLECT function is automatically added; the COLLECT function is an aggregate calculation that combines the values in the argument field; this argument must be a Geometry type.
If you have Longitude and Latitude in your data set, you can use the MAKEPOINT to convert this into a single combined object for usage in your data visualisations.
MakeLine
We are now going to update our data visualisation by dragging Line and dropping it on top of COLLECT(To Point) on the Details Mark, we want to replace this. You should now see the following:
We now have a line connecting the To Point and From Point using the MAKELINE function, and we plotted this onto a data visualisation.
Combining
To finish off this quick feature review, we are going to have a little fun and combine the two versions above into a single data visualisation.
- Keep your finger of Ctrl (or Command for iOS) and drag Longitude (generated) to the right to create a copy.
- Click on the Longitude (generated) to show the Marks Panel.
- Drag To Point from the Data Pane and drop this on top of COLLECT(Line) to replace it.
- Right-click on the Longitude (generated) on the right and select Dual Axis.
You should now have the following:
and boom, we are done, I hope you had fun learning about this feature and you can read more about this on the Tableau Official Online help: https://onlinehelp.tableau.com/current/pro/desktop/en-gb/functions_functions_spatial.htm
Note: Tableau will be making improvements to the Spatial functions in 2019.3 and I cannot wait to see what they come up with.
Summary
I hope you all enjoyed this article as much as I enjoyed writing it. Do let me know if you experienced any issues recreating this Visualisation, and as always, please leave a comment below or reach out to me on Twitter @Tableau_Magic.
