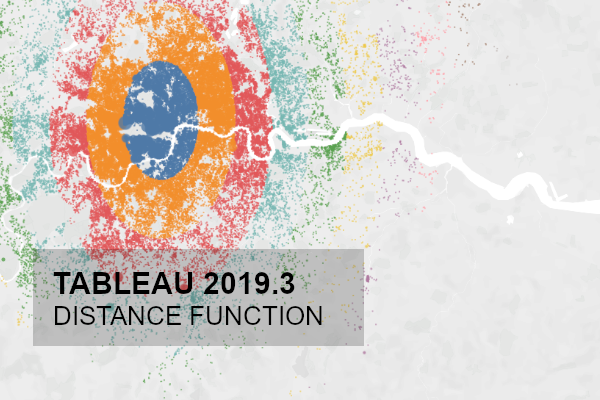
Tableau 2019.3 was released on Tuesday 17th September 2019 and comes with some very (very) nice features. In this article, we are going to spend the next 10 minutes to look into the new Distance that allows you to calculate the distance between two points.
Data
Firstly, we will grab some geographic data from Airbnb and load this into Tableau. Click on the following link and download and load into Tableau the file for your desired city: http://insideairbnb.com/get-the-data.html
Note: I am from London, so I will base the tutorial on London. But it does not matter which City you choose.
Calculated Fields
We will start by creating the following Calculated Fields, Parameters and Bins.
Parameter called Lat
- Name: Lat
- Data type: float
- Current Value: 0
- Display format: Automatic
- Allowable values: All
Parameter called Long
- Name: Long
- Data type: float
- Current Value: 0
- Display format: Automatic
- Allowable values: All
Parameter called Units
- Name: Units
- Data type: String
- Allowable values: List with the following values
- meters
- kilometers
- miles
- feet
- Current value: kilometers
Distance
DISTANCE(MAKEPOINT([latitude], [longitude]), MAKEPOINT([Lat],[Long]),[Units])Note: What we are doing here is creating a point using the MAKEPOINT function for the data set, we are also creating a point using MAKEPOINT with the Parameters, and lastly we are using the Units parameter to allow you to select your units of measurement.
Create a Bin called Distance (bin)
- Right-click on the Distance, go to Create and select Bin…
- Leave the Name as Distance (bin)
- Set the Size of bins to 5.
And that is all we need to start building our Worksheet:
Worksheet
In this worksheet, we are going to build a map and make use of Parameter Actions. So lets get started.
- Change the Mark Type to Map.
- Drag Longitude onto Columns.
- Right-click on this object and select Dimension.
- Drag Latitude onto Rows.
- Right-click on this object and select Dimension.
- Drag Distance (bin) onto the Color Mark.
- Drag price onto the Size Mark.
We have now built our data visualization, but now I want us to add two Parameter Actions to give our dashboard some very cool interactivity.
- In the Application Menu, go to Worksheet, and select Actions…
- Click on Add Action and select Change Parameter.
- Change the Name to Lat.
- Set Target Parameter to Lat.
- Set Run action on to Select.
- Set Field to latitude.
- Set Aggregation to None.
- In the Application Menu, go to Worksheet, and select Actions…
- Click on Add Action and select Change Parameter.
- Change the Name to Long.
- Set Target Parameter to Long.
- Set Run action on to Select.
- Set Field to longitude.
- Set Aggregation to None.
With the Parameter Actions created, you should now be able to click on a single point, the Lat and Long parameters will be updated, and you should now see rings around this point representing the distance from this point based on your Unit settings.
You can have some fun with the Units, Bin size, Colours, and I can see many interesting applications for this newly minted function.
Note: The Distance function is currently not available in Hyper, therefore, I cannot publish this onto Tableau Public.
Summary
I hope you all enjoyed this article as much as I enjoyed writing it. Do let me know if you experienced any issues recreating this Visualisation, and as always, please leave a comment below or reach out to me on Twitter @Tableau_Magic.
If you like our work, do consider supporting us on Patreon, and for supporting us, we will give you early access to tutorials, exclusive videos, as well as access to current and future courses on Udemy:
- Patreon: https://www.patreon.com/tableaumagic
Also, do be sure to check out our various courses:
- Creating Bespoke Data Visualizations (Udemy)
- Introduction to Tableau (Online Instructor-Led)
- Advanced Calculations (Online Instructor-Led)
- Creating Bespoke Data Visualizations (Online Instructor-Led)
