


")


Tableau allows you to create custom colour palettes for use in your data visualisation. Now, you can always assign custom colours in your workbooks, however, you may want to create an organisation wide colour palette to ensure that all dashboards have the same colours and look and feel. In this quick tip, we are going to spend 15 minutes looking at how we go about creating these.
Preference.tps
Custom colour palettes are defined in your Preference.tps file. You can locate this in your My Tableau Repository. Let us open this and have a look at its contents.
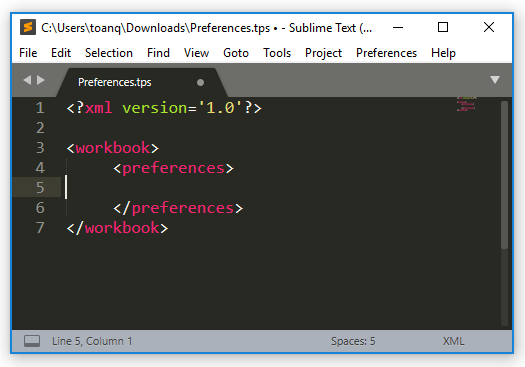
This is an XML file, as defined by the content in line 1. To add our colours, we need to add our palette in between the preferences tag. Let us explore the different types of palettes.
Note: I use Sublime Text 3 as my default text editor as it has syntax highlight as well as some additional niceties. This is free and available here: https://www.sublimetext.com/3
Sample Worksheet
To demonstrate our colour palettes, copy and paste the following data into a Tableau Desktop / Tableau Public.
Country,Value
United States,8797
India,5502
United Kingdom,2039
Canada,720
Australia,693
Germany,613
Singapore,567
France,532
Brazil,382
China,360
We will build worksheets with this data and colour it using our new palettes.
Regular
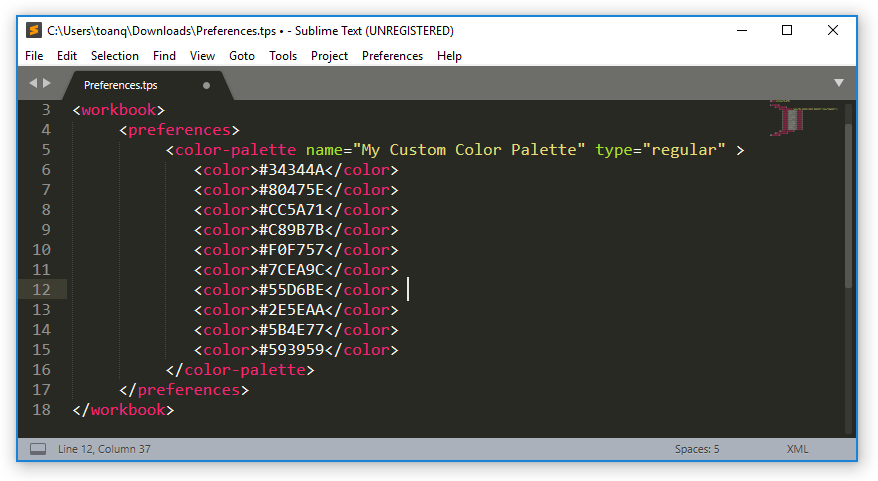
Let us start by creating our first regular, or categorical, colour palette by adding the following lines to the Preference.tps file between the preferences tag.
<color-palette name="My Custom Color Palette" type="regular" >
   <color>#34344A</color>
   <color>#80475E</color>
   <color>#CC5A71</color>
   <color>#C89B7B</color>
   <color>#F0F757</color>
   <color>#7CEA9C</color>
   <color>#55D6BE</color>
   <color>#2E5EAA</color>
   <color>#5B4E77</color>
   <color>#593959</color>
</color-palette>
You should have the following:
Note: you have to restart Tableau to reload your new colour palette.
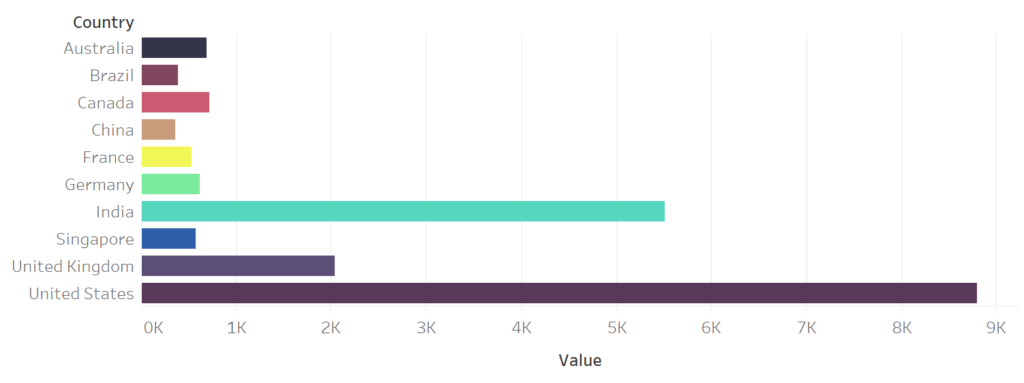
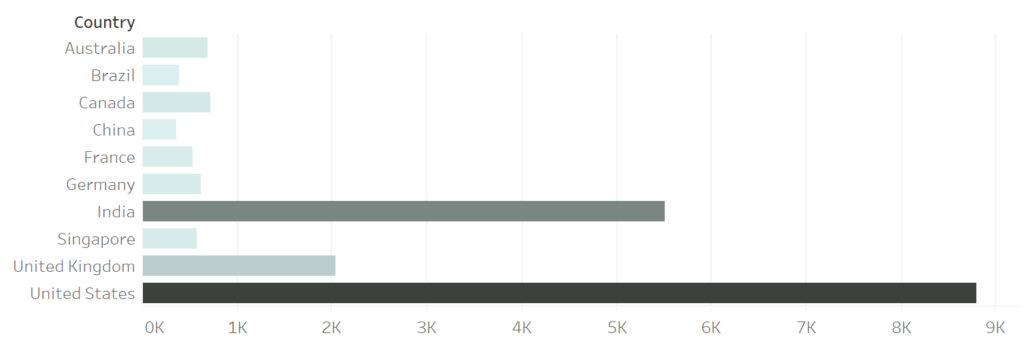
After you restart Tableau Desktop / Tableau Public, let us build a data visualisation by:
- Drag Country onto Rows.
- Drag Country onto the Colour Mark.
- Drag Value onto Columns.
- Click on the Color Mark.
- In Select Color Palette, choose My Custom Color Palette.
- Click Assign Palette.
- Click Apply.
- Click Ok.
You should now have the following:
Note: you can also assign your colour palette to the entire data source by right-clicking on a dimension, going to default properties, and selecting color. This way you set the color for your entire data source, and this can also be applied to Tableau Server Data Sources.
Sequential and Divergent
When you are creating custom colours you have three types of palettes which can be set in the type attribute:
- regular: was used in the example above and applies to dimensions as it is a series of solid colours.
- ordered-sequential: A sequential palette, is typically used to define a palette with a single colour but additional intensities; this palette type is commonly used on continuous fields and measures.
- ordered-divergent: A diverging palette shows two ranges of values using colour intensity to show the magnitude of the number and the actual colour to show which range the number is from. Diverging palettes are most commonly used to show the difference between positive and negative numbers.
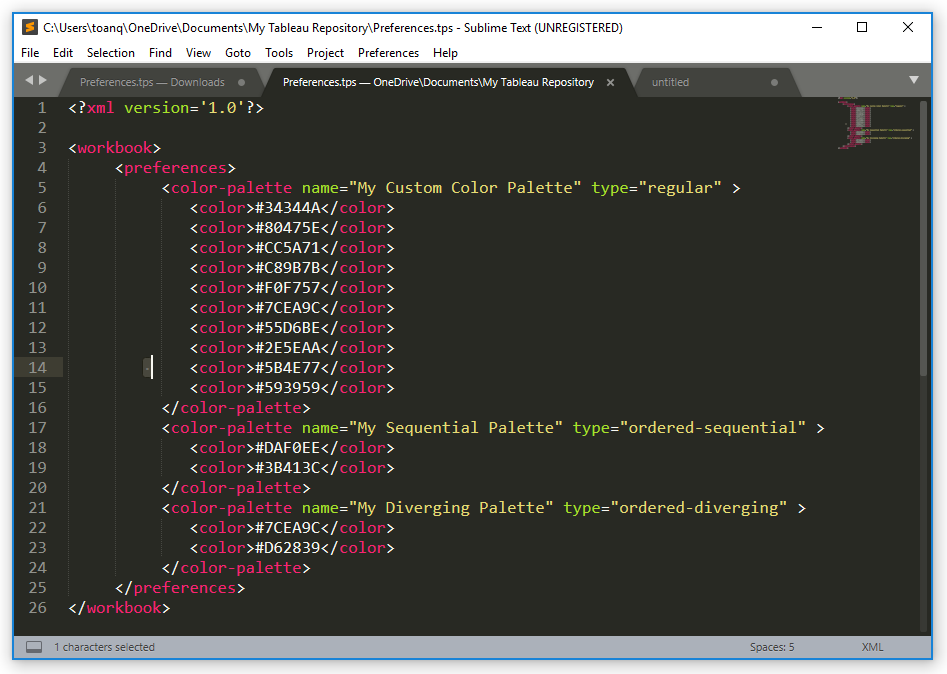
With this in mind, let us add two additional colour palettes to our Preference.tps file.
<color-palette name="My Sequential Palette" type="ordered-sequential" >
   <color>#DAF0EE</color>
   <color>#3B413C</color>
</color-palette>
<color-palette name="My Diverging Palette" type="ordered-diverging" >
   <color>#7CEA9C</color>
   <color>#D62839</color>
</color-palette>
Your Preference.tps file should look like the following:
Now restart Tableau to reload your palettes, and try and use these two new colour palettes by dragging Value onto the Colour Mark and applying the new colour palettes. You should have the following:
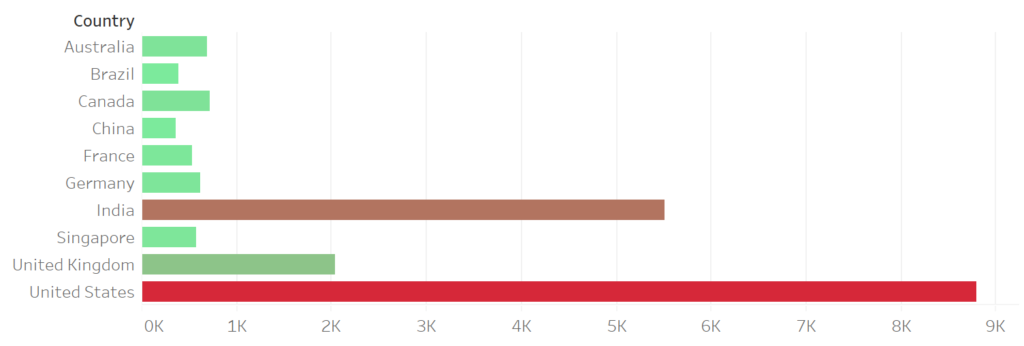
As you can see, it is extremely easy to create your own colour palettes.
Color Palette Generators
Coming up with your own colour palettes can be daunting, yep, it is easy, but where do we start? Below we are going to talk about my favourite online colour palette generators.
- Coolers: https://coolors.co
- Paletton: https://paletton.com
- MyColor: https://mycolor.space
These are a small selection of websites that are really cool to use.
Tableau Magic Color Palette Generator
We have also built a Tableau Colour Palette Generator for you to use; this tool will allow you to upload an image and get the code for you to paste into your Preference.tps file.
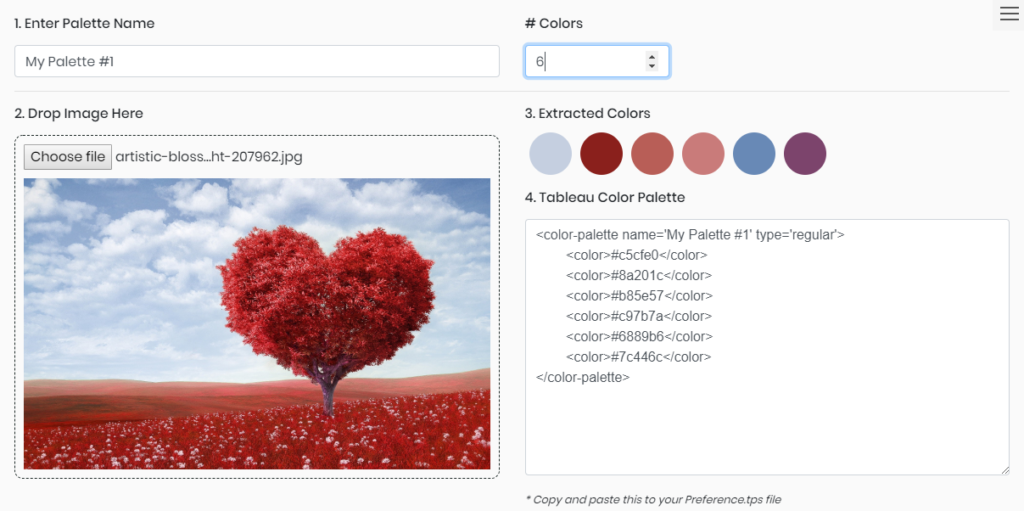
You can find the Tableau Magic Color Palette Generator here: https://color.tableaumagic.com
Summary
I hope you all enjoyed this article as much as I enjoyed writing it. Do let me know if you experienced any issues recreating this Visualisation, and as always, please leave a comment below or reach out to me on Twitter @Tableau_Magic.
If you like our work, do consider supporting us on Patreon, and for supporting us, we will give you early access to tutorials, exclusive videos, as well as access to current and future courses on Udemy:
Also, do be sure to check out our various courses:
- Creating Bespoke Data Visualizations (Udemy)
- Introduction to Tableau (Online Instructor-Led)
- Advanced Calculations (Online Instructor-Led)
- Creating Bespoke Data Visualizations (Online Instructor-Led)


 Table Calculation")


")

Loved the examples, looking forward for more from the Master Magician. Thx Toan
Hi Toan. Is it possible to link the colours to specific measures, e.g. footballs teams. Arsenal = Red, Chelsea = Blue, Etc?
Measures have a range, sequential or divergent colours, Teams would normally be dimensions and yes, you can align with there colours.
Hello Toan,
Can you please give us the preferences.tps for custom color file
To abhijnakbvr@gmail.com