


")


Custom Shapes allows you to add an extra dimension to your visualisation and have the benefit of being very easy to do. As such, in this quick tip, we are going to spend 10 minutes talking about where you can find icons and how you can make them accessible in Tableau.
Note: Custom shapes can also create confusion and subtract away from your data visualisation, so please use when appropriate.
Adding Shapes
To add shapes is a very easy thing to do in Tableau.
- Locate the My Tableau Repository directory.
- Within the directory, there should be a folder called Shapes.
- Create a new folder called Custom Shapes.
- This is where we are going to put our shape image files.
We are going to have some fun and download a few shapes and save them into this folder for usage within Tableau.
Shape Sources
You can always create your own custom shapes, however, there are quite a few websites out there that provide images for you to use:
- Go to http://fa2png.io
- In the configuration box:
- Search for wi-day-cloudy.
- Set the Color of the icon to #000000.
- Leave the Background of the icon as transparent.
- Leave the Size of the icon as 256px.
- Leave the Margin of the icon as 0px.
- Click on Generate.
- After the image has been generated, click on Download, to save this image.
- Repeat the above for the following icons:
- wi-day-fog
- wi-day-rain
- wi-day-sunny
- Copy these files into your Custom Shapes folder.
Note: Font Awesome gives you scalable vector icons that can instantly be customized — size, color, drop shadow, and anything that can be done with the power of CSS. I use this often in my websites and this site allows you to download the png version. This site also has plenty of other web icon libraries for download.
Worksheet
Copy the following data set and load this into Tableau Desktop / Public.
Weather, Days of Year
Cloudy, 80
Fog,100
Rain,120
Sunny,65
Once the data is loaded, we are going to build our worksheet:
- Change the Mark Type to Shapes.
- Drag Weather onto the Color Mark.
- Drag Weather onto the Shape Mark.
- Drag Days of Year onto the Size Mark.
- Drag Days of Year onto the Label Mark.
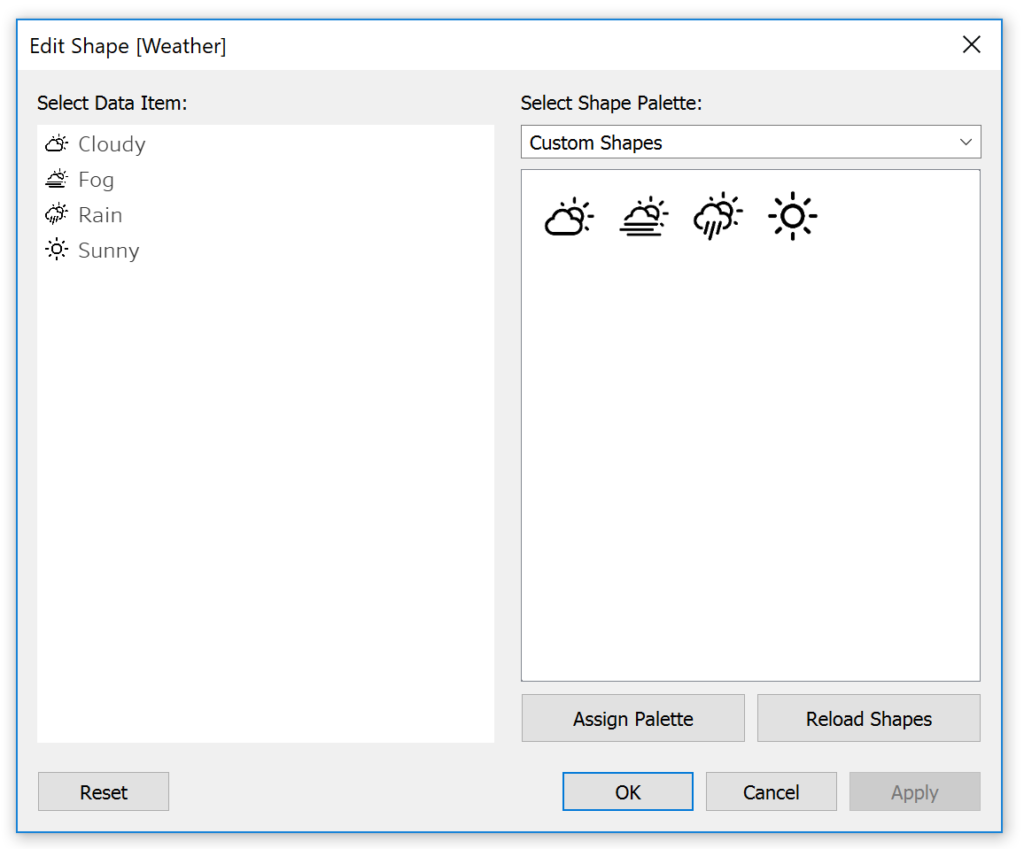
- Click on the Shape Mark.
- Click Reload Shapes to ensure that your shapes are loaded into Tableau.
- In the Select Shape Palette choose Custom Shapes.
- Now assign the Shapes to your Weather Dimensions by matching the text in Select Data Item to your custom shapes.
- The click apply.
You want something like the following:
Your worksheet will now look like the following:
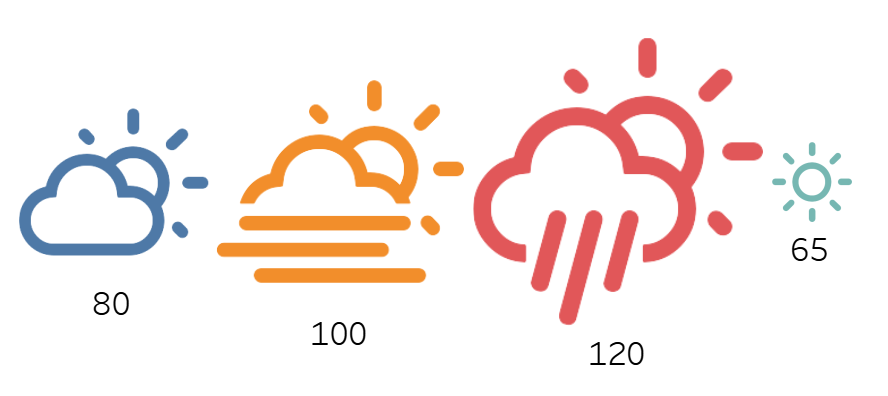
Yep, I am from London and we do not have enough sunny days each year, this is fake data, but jokes aside, we can leverage any shapes that we can get out hands-on. Use this Tableau Quick Tip (QT) responsibly and have loads of fun.
Summary
I hope you all enjoyed this article as much as I enjoyed writing it. Do let me know if you experienced any issues recreating this Visualisation, and as always, please leave a comment below or reach out to me on Twitter @Tableau_Magic.
If you like our work, do consider supporting us on Patreon, and for supporting us, we will give you early access to tutorials, exclusive videos, as well as access to current and future courses on Udemy:
- Patreon: https://www.patreon.com/tableaumagic
Also, do be sure to check out our various courses:
- Creating Bespoke Data Visualizations (Udemy)
- Introduction to Tableau (Online Instructor-Led)
- Advanced Calculations (Online Instructor-Led)
- Creating Bespoke Data Visualizations (Online Instructor-Led)
 Table Calculation")


Thx Toan, had fun the custom shapes, looking forward for more.
I am glad, it was fun to write 🙂
Hey Toan, great article!
I have a doubt, is there a way to relacionate the shapes with the information?
For example, I have 300 shapes named (Shape1.jpg, Shape2.jpg …. Shape300.jpg) and I have the sale information of each Shape. Is there a way to relacionate each other?
Or I have to do it manually, shape by shape?
Manually I believe…