
This is a Quick Tip on how to build Dual Bar Charts in Tableau, so less reading and more jumping in. We are going to spend 5 minutes or less building our Dual Bar charts.
Data
Load the following data into Tableau Desktop / Public.
| Country | Sales (2017) | Sales (2018) | Target Sales (2018) |
| United States | 773200 | 820000 | 850520 |
| United Kingdom | 904800 | 745010 | 995280 |
| Germany | 596700 | 710008 | 656370 |
| France | 340600 | 360150 | 374770 |
| India | 477750 | 390055 | 525500 |
Worksheet
- Drag Country onto Rows.
- Drag Sales (2017) onto Columns.
- Drag Sales (2018) onto Columns.
- Right-click on the Sales (2018) pill in columns and select Dual Axis.
- Right-click on the Sales (2018) header and select Synchronized Axis.
- In the All Marks Panel:
- Change the Mark Type to Bar.
- Remove the Measure Names from Color.
- In the SUM(Sales (2017)) Marks Panel:
- Click on Color and select a shade of Grey.
- Click on Size and set the size to 75%.
- This will represent the previous year.
- In the SUM(Sales (2018)) Marks Panel:
- Drag Country onto Color.
- Click on Color and set the border to White.
- Drag Target Sales (2018) onto Detail.
- Click on Size and set the size to 50%.
- On the Canvas:
- Right-click on the Sales (2018) header and choose Add Reference Line.
- In the Add Reference Line, Band, or Box:
- Set Scope to Per Cell.
- Set Value to SUM(Target Sales (2018)).
- Set Label to None.
- Set Line to Dots and Second Smallest Size.
- Click Ok.
Now we need to adjust the visualisation by:
- Editing tooltips.
- Editing colours.
- Remove gridlines.
- Hide headers.
And you should then end up with something like the following:
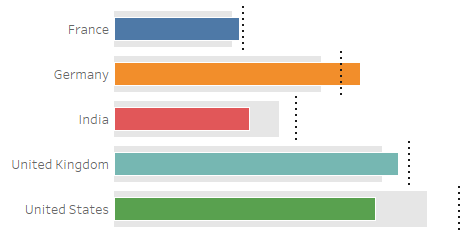
This is a nice and quick visualisation that a lot of my clients really seem to like. For example, you can see the following extremely quickly:
- Germany is the only country whose 2018 sales Exceeded their 2018 target.
- India and the United States 2018 sales DID NOT surpass their respective 2017 sales.
- France and the United Kingdoms 2018 sales Exceeded 2017 sales but DID NOT surpass their 2018 targets.
Summary
I hope you all enjoyed this article as much as I enjoyed writing it. Do let me know if you experienced any issues recreating this Visualisation, and as always, please leave a comment below or reach out to me on Twitter @Tableau_Magic.
If you like our work, do consider supporting us on Patreon, and for supporting us, we will give you early access to tutorials, exclusive videos, as well as access to current and future courses on Udemy:
- Patreon: https://www.patreon.com/tableaumagic
Also, do be sure to check out our various courses:
- Creating Bespoke Data Visualizations (Udemy)
- Introduction to Tableau (Online Instructor-Led)
- Advanced Calculations (Online Instructor-Led)
- Creating Bespoke Data Visualizations (Online Instructor-Led)