

This is a Quick Tip on how to build a League Table in Tableau, so less reading and more jumping in. We are going to spend 5 minutes or less building our League Table in Tableau.
Note: As always never choose a data visualisation type and try to fit your data into it, instead, understand your data and choose the best visualization for your data consumers.
Data
Load the following data into Tableau Desktop / Public.
| Country | Date | Value |
| United States | 01-Jan-2019 | 100 |
| United States | 01-Feb-2019 | 80 |
| United States | 01-Mar-2019 | 110 |
| United States | 01-Apr-2019 | 100 |
| United Kingdom | 01-Jan-2019 | 80 |
| United Kingdom | 01-Feb-2019 | 90 |
| United Kingdom | 01-Mar-2019 | 120 |
| United Kingdom | 01-Apr-2019 | 60 |
| Canada | 01-Jan-2019 | 70 |
| Canada | 01-Feb-2019 | 70 |
| Canada | 01-Mar-2019 | 100 |
| Canada | 01-Apr-2019 | 120 |
Calculations
We only require a single Calculation:
Rank
RANK_UNIQUE(MAX([Value]))Yep, that is the only Calculated Field that we require.
Worksheet
To start building our dashboard:
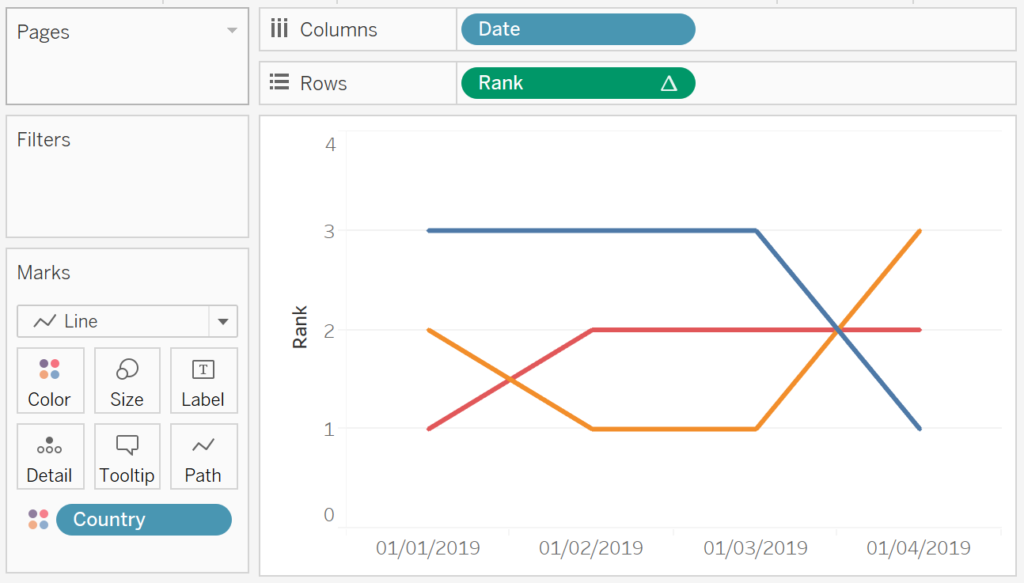
- Change the Mark Type to Line.
- Drag Date onto Columns.
- Right-click and select Exact Date.
- Right-click and select Dimension.
- Drag Country onto the Color Mark.
- Drag Rank onto Rows.
- Right-click on the object, go to Compute Using and select Country.
If all goes well you should see the following:

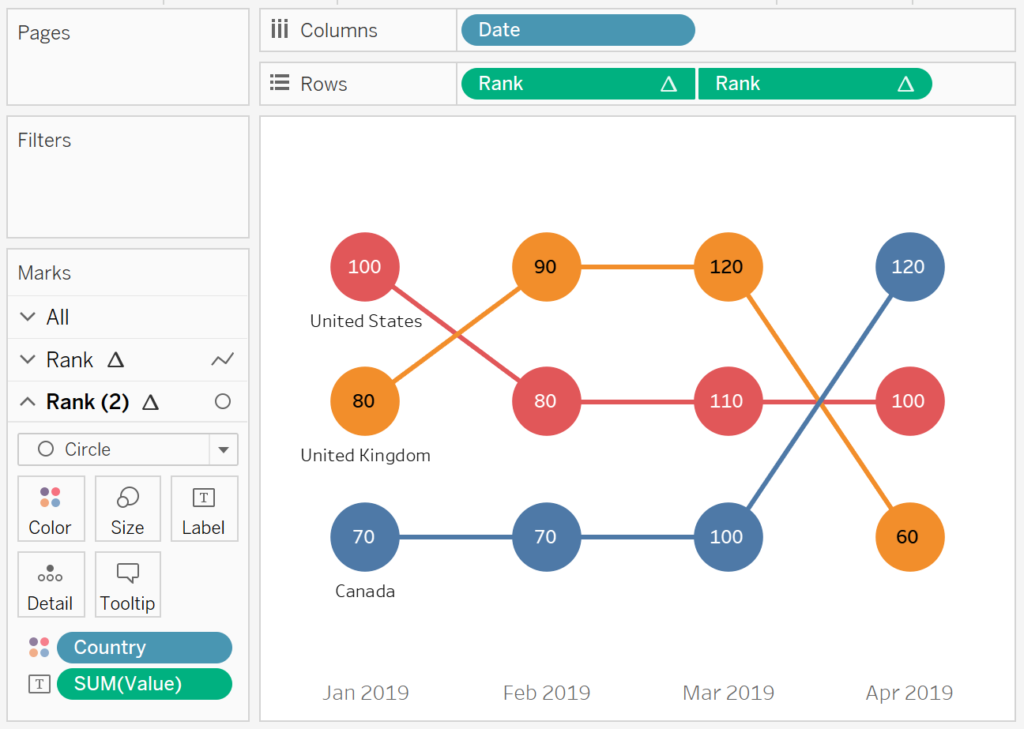
Now we want to adjust the visualisation by doing the following:
- Ctrl-drag the Rank pill in Rows to the right to create a copy.
- Right-click on the newly created object and select Dual Axis and then Synchronize Axis.
- Change the Mark Type of the newly created object to Circle.
- Drag Value onto the Label Mark Type for this newly created object. Change the alignment of the Label to be vertically and horizontally centred.
- Double-click on the Rank Axis Header and select Reversed.
- Hide the Axis Headers.
- Remove all Gridlines.
- Adjust the Sizes.
- Add a Country Label to the Rank with the Line Mark Type.
- Set Marks to Label to Line Ends and untick Label end of .
- Customise the Date format to mmm yyyy.
If all goes well you should now have the following:

and boom, we are done, nice, simple and quick. You find my League Table Dashboard on Tableau Public at https://public.tableau.com/profile/toan.hoang#!/vizhome/LeagueTable_1/LeagueTable
Summary
I hope you all enjoyed this article as much as I enjoyed writing it. Do let me know if you experienced any issues recreating this Visualisation, and as always, please leave a comment below or reach out to me on Twitter @Tableau_Magic.
If you like our work, do consider supporting us on Patreon, and for supporting us, we will give you early access to tutorials, exclusive videos, as well as access to current and future courses on Udemy:
- Patreon: https://www.patreon.com/tableaumagic
Also, do be sure to check out our various courses:
- Creating Bespoke Data Visualizations (Udemy)
- Introduction to Tableau (Online Instructor-Led)
- Advanced Calculations (Online Instructor-Led)
- Creating Bespoke Data Visualizations (Online Instructor-Led)