


")


This is a Quick Tip on how to build a Pyramid Step Chart in Tableau, so less reading and more jumping in. We are going to spend 5 minutes or less building our Pyramid Step Chart in Tableau.
Note: As always never choose a data visualisation type and try to fit your data into it, instead, understand your data and choose the best visualization for your data consumers.
Data
Load the following data into Tableau Desktop / Public.
Country,Path,Value
United States,1,0.8
United States,101,0.8
United Kingdom,1,0.67
United Kingdom,101,0.67
France,1,0.4
France,101,0.4
Germany,1,0.5
Germany,101,0.5
Japan,1,0.9
Japan,101,0.9
Note: we require path and duplicate lines for densification. See our tutorial on Data Densification for more information. Click here
Calculations
We will start by creating the following calculated fields.
Path (bin)
- Right-click on Path
- Go to Create, and select Bins…
- In the Edit Bins window:
- Set New field name to Path (bin).
- Set Size of bins to 10.
- Click OK.
Index
INDEX()TC_Value
WINDOW_MAX(MAX([Value]))Color
IF [Index] > WINDOW_MAX([Index])*(1-[TC_Value]) THEN
    IF [TC_Value] > 0.8 THEN
        "Green"
    ELSEIF [TC_Value] < 0.5 THEN
        "Red"
    ELSE
        "Orange"
    END
ELSE
    "Grey"
END
Worksheet
Now that we have created our Calculated Fields, we will build our Worksheet.
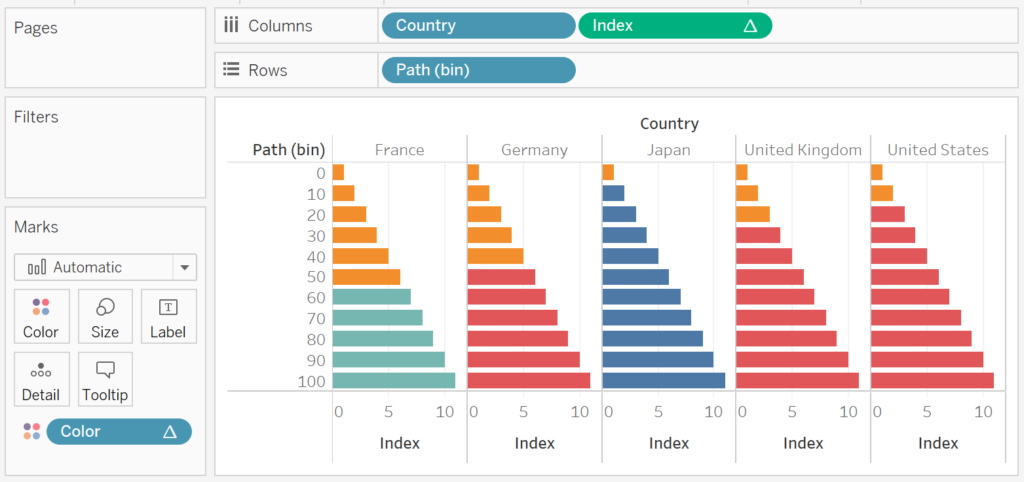
- Change the Mark Type to Bar.
- Drag Country onto Columns.
- Drag Path (bin) onto Rows.
- Right-click on the object and ensure that Show Missing Values is check.
- Drag Index onto Columns.
- Right-click on the object, to go Compute Using and select Path (bin).
- Drag Color onto the Color Mark.
- Right-click on the object, to go Compute Using and select Path (bin).
- Right-click on the object and select Edit Table Calculation.
- With Nested Calculation set to Color, select Specific Dimensions.
- Select both Country and Path (bin) and ensure that Country is on top.
- Set Restarting every to Country.
If all goes well, you should have the following:
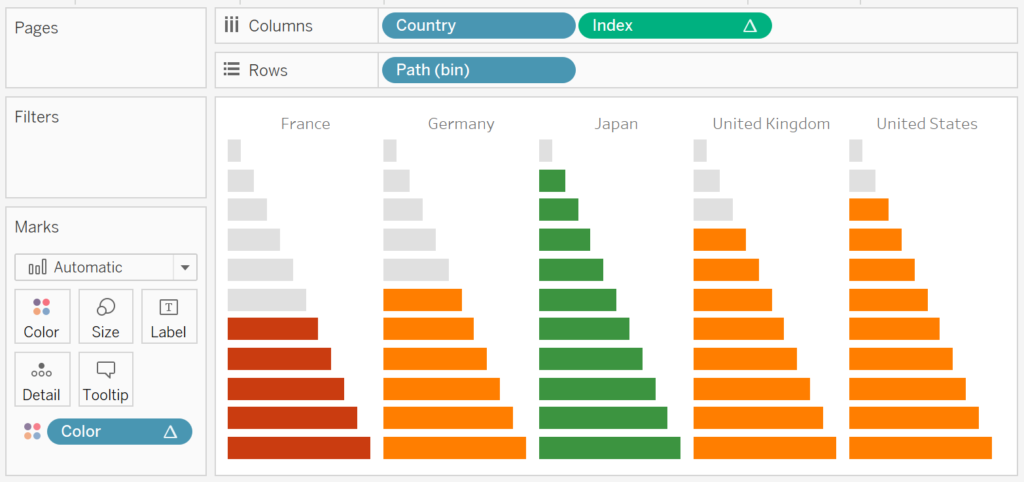
Now we will adjust the cosmetics:
- Hide the headers.
- Set Row Divider to None.
- Set Column Divider to None.
- Set Zero Line to None.
- Set Grid Lines to None.
- Edit the Colors.
We are almost there, we have a half pyramid and should have something like the following:
Now we have the following final touches.
- Drag Value to Columns between Country and Index.
- Right-click on this object and set this to Discrete and Dimension.
- Format this to a percentage.
- Keep your finger on Ctrl, and left-click on Index and Drag to right and let it go, this will copy the Index Pill. This is a real time-saver.
- Now the final touch will be to double-click on the left Index Pill, add a minus sign to the left; this is an example of inline manipulation.
You should now see the following:
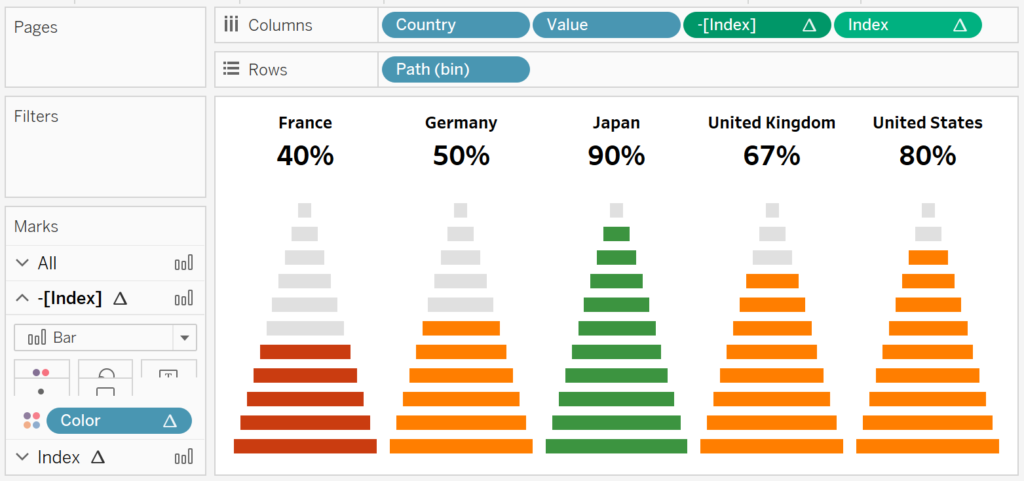
and boom, we are done, nice, simple and quick. You find my Pyramid Step Chart Dashboard on Tableau Public at
https://public.tableau.com/profile/toan.hoang#!/vizhome/PyramidStepCharts/PyramidStepChart
Summary
I hope you all enjoyed this article as much as I enjoyed writing it. Do let me know if you experienced any issues recreating this Visualisation, and as always, please leave a comment below or reach out to me on Twitter @Tableau_Magic.
If you like our work, do consider supporting us on Patreon, and for supporting us, we will give you early access to tutorials, exclusive videos, as well as access to current and future courses on Udemy:
- Patreon: https://www.patreon.com/tableaumagic
Also, do be sure to check out our various courses:
- Creating Bespoke Data Visualizations (Udemy)
- Introduction to Tableau (Online Instructor-Led)
- Advanced Calculations (Online Instructor-Led)
- Creating Bespoke Data Visualizations (Online Instructor-Led)


Toan Hoang, thanks for the tutorial I am awestruck by your drawings and out of box charts in Tableau and lucky to be part of Tableau Magic. Hope you will be adding tutorials for the below charts.
1) Stacked 3D Circle Charts in Tableau
2) Filled Arc Timeline Charts in Tableau
3) Dot Quadrant Charts in Tableau
One small change required, we have to change the below line
Drag Value to Columns between Country and Index.
to
Drag TC_Value to Columns between Country and Index.
Hi Navindran, I did a quick check, dragging Value works just as well as dragging TC_Value.
Hi Toan,
May be I have gone wrong somewhere, I am getting multiple values for a country if I use Values field as Dimension and Discrete, will share the public link to you
Send me your packaged workbook to Toan.hoang@keyrus.com, I will have a look.
Hi Navindran, Dot Quadrant has been scheduled for the 6th May, I have not scheduled the Filled Arc Timeline chart yet, and unsure about the Stacked 3D Circle Charts, but both will probably be released within the next few weeks.
Thx Toan
Hi Toan,
Again with fantastic chart.
I have been facing an issue regarding Table Calculation :
After place color field onto color. I have set “Compute Using” Country and Path (bin) (First country then path (bin)
“At the level” : Deepest
Restarting every : Country
But my chart not shrink as your in the above picture. I have using Tableau 9.2.
Thanks
Please send me the workbook and I will have a look.
Thanks for the reply @Toan
I am unable to attached the filer here in the comment section.
How i send you workbook ?
Thanks
Send an email to Toan.hoang@keyrus.com
Okay Thanks
I might have missed it but I had to set the Bin size to 10 instead of 1 as instructed.
Yep, I have updated the blog, you can play around with Bin size to adjust as necessary.
Hi Toan, I recently came through your website and became a big fan. In fact I saved most of your pages in my favorites. I tried to copy your graphs using Super Store data but could not do. May I request you to please use Super Store data in your examples. It will be easy, for people like me, to understand better. Thanks!
Hi Rajesh, welcome. In my recent tutorials, I have started l using Sample Super store, I am planning on revisiting my older articles too, when time permits.