


")


I thought that this week’s Tableau Quick Tip will be something a little different and fun, so here you go, our Waffle Image in Tableau.
Note: This is an alternative type of data visualisation, and sometimes pushed for by clients. Please always look at best practices for data visualisations before deploying this into production.
Data
We will start by loading the following data into Tableau Desktop / Tableau public.
Path
1
100
Yep, that is all that we need for now, and we are going to play with Data Densification.
Calculated Fields
We only need to create the following Parameters and Calculation Fields:
@Number of Columns Parameter
- Set Name to @Number of Columns
- Set Data type to Integer
- Set Current value to 15
Path (bin)
- Right-click on Path, go to Create and select Bins…
- In the Edit Bins dialogue window:
- Set New field name to Path (bin)
- Set Size of bins to 0.5
- Click Ok
Index
INDEX()-1Rows
IF ([Index]%[@Number of Columns]) < [@Number of Columns]/2 THEN
    ROUND([Index]/[@Number of Columns],0)
ELSE
    ROUND([Index]/[@Number of Columns],0)-1
END
Columns
FLOAT([Index]%[@Number of Columns])Images
We will now create the following images:
- Go to your favourite royalty-free image website and download something cool, my favourite is: https://www.pexels.com
- In this example, I downloaded a 640 by 426-pixel image
- There are quite a few image-splitting websites out there, I will probably have some fun and create my own image splitter, but until then, you can use the following: https://www.imgonline.com.ua/eng/cut-photo-into-pieces-result.php
- In Select image in BMP, GIF, JPEG, PNG, TIFF format: choose your downloaded image
- In Cutting settings for photo
- In Parts in width set the value to 15
- In Parts in height set the value to 10
- In Output images format select PNG-24
- Click on the big OK button
- Once the website has processed your images, click on the Download .zip archive with all parts of image
We have now downloaded an image, used an online service to split the image, we now need to Unzip the files into your My Tableau Repository\Shapes directory.
Note: If you need, please refer to the my following Tableau Quick Tip on Customer Shapes here
With this done, let us start creating our data visualisation.
Worksheet
We will now build our worksheet:
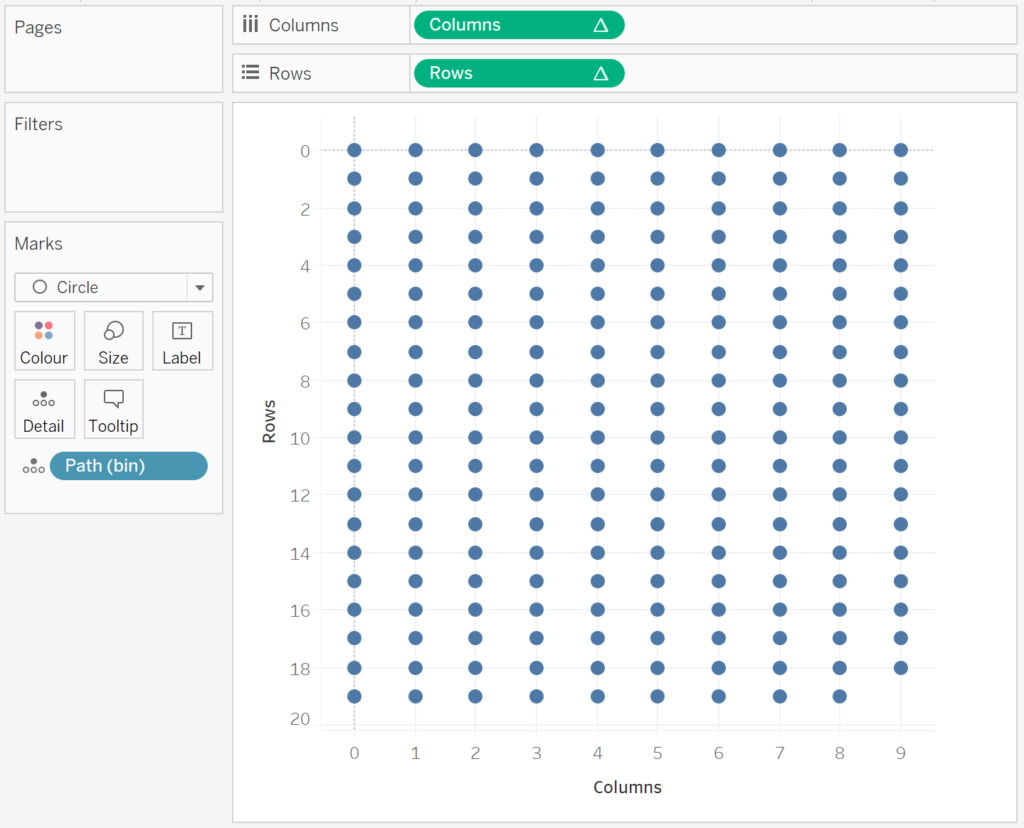
- Change the Mark Type to Circle
- Drag Path (bin) onto the Columns Mark
- Right-click on this pill and ensure that Show Missing Values is selected
- Drag this pill onto the Detail Mark
- Drag Columns onto the Columns Shelf
- Right-click on this pill, go to Compute Using and select Path (bin)
- Drag Rows onto the Rows Shelf
- Right-click on this pill, go to Compute Using and select Path (bin)
- Double-click on the Rows Axis Header and select Reverse
If all goes well, you should not see the following
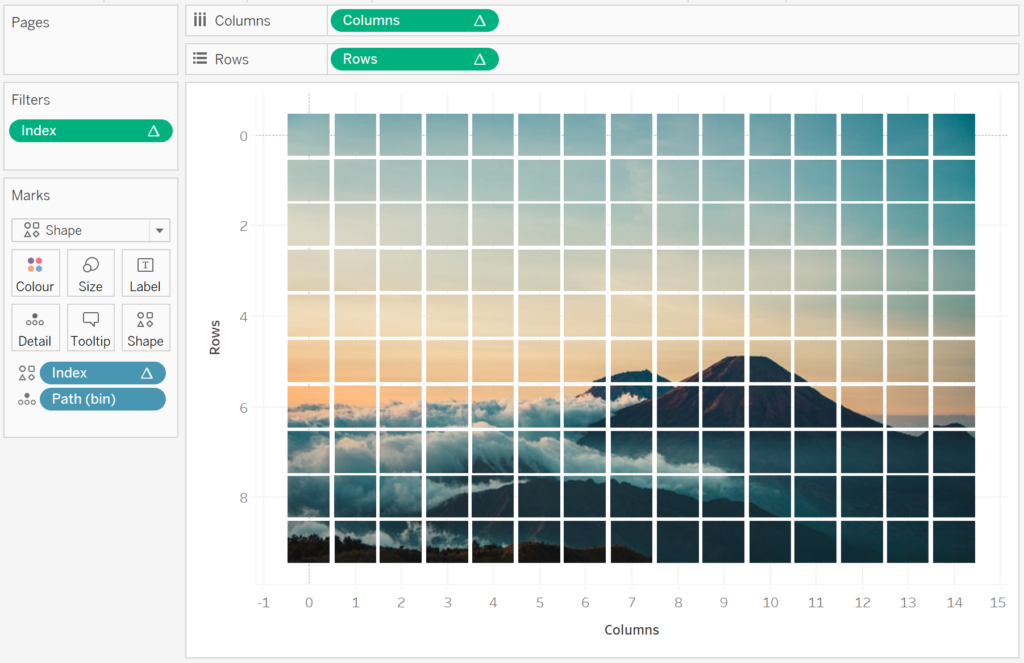
Now we apply our sliced images:
- Change the Mark Type to Shape
- Drag Index onto the Shape Mark
- Right-click on this pill, go to Compute Using and select Path (bin)
- Ctrl Drag and Drop (to copy) this pill onto the Filters Shelf and filter the Index to match the number of image slices we have produced i.e. if we have 15 by 10, then we will want the Index to go from 0 to 149.
- Click on the Shape Mark
- In Select Shape Palette, select your folder (click Reload Shapes if required)
- Click Assign Palette
- Click Ok
- Adjust the Size of your marks
You should now have the following:
and finally, we will adjust the final cosmetics:
- Hide the Zero Lines
- Hide the Grid Lines
- Hide the Axis Headers
- Disable Tool Tips
and we should hopefully end up with our final data visualisation:
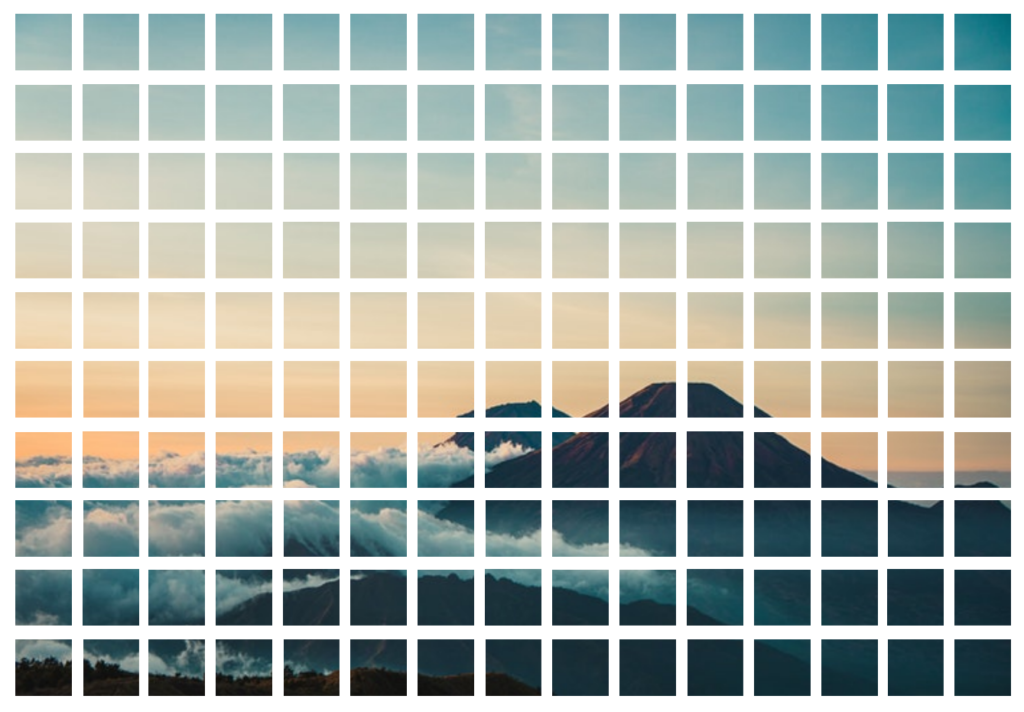
and boom, we are done with this Tableau Quick Tip, and I hope you had some seriously good fun; as always, you can find my data visualisation on Tableau Public at https://public.tableau.com/profile/toan.hoang#!/vizhome/WaffleImage/WaffleImage
Summary
I hope you all enjoyed this article as much as I enjoyed writing it and as always do share the love. Do let me know if you experienced any issues recreating this Visualization, and as always, please leave a comment below or reach out to me on Twitter @Tableau_Magic. Do also remember to tag me in your work if you use this tutorial.
If you like our work, do consider supporting us on Patreon, and for supporting us, we will give you early access to tutorials, exclusive videos, as well as access to current and future courses on Udemy: https://www.patreon.com/tableaumagic

 Table Calculation")


ok your instructions are amazing but I am a tableau newbie and I got stuck on creating the Path (bin). I have my image split and it is unzipped and saved. But im not sure how to download the data information. Is it part of my image file?