


")


In the past 5 years, I have been programming a lot with JavaScript, from simple jQuery to Angular to React. This has been mainly for my personal projects and surprisingly I have not spent too much time looking at the Tableau JavaScript API, so why not have a look. The Tableau JavaScript API allows you to do several things with Tableau:
- Embed data visualizations from Tableau Server, Tableau Public, and Tableau Online inside of web pages.
- Filter the data inside the visualizations using HTML controls.
- Select marks within the dashboard.
- Respond to events within the dashboard.
- Export the dashboard to various output formats.
In this introductory article, we are aiming to get you up and running within 10 minutes, yes, 10 minutes. With our other technical articles we installed a lot of software, but with this tutorial, we will leverage an online coding platform, so with that said and done, let’s crack on with it.
Note: One of my side projects for next year will be to create an open source Tableau portal, just for fun. So if there are any coders out there, send me a message.
Getting Started
Let us first get started by opening a web browser and going to https://codepen.io and creating an account.
CodePen is an online community for testing and showcasing user-created HTML, CSS and JavaScript code snippets. It functions as an online code editor and open-source learning environment, where developers can create code snippets, creatively named “pens”, and test them. It was founded in 2012 by full-stack developers Alex Vazquez, Tim Sabat and front-end designer Chris Coyier. Its employees work in a decentralized, remote environment, rarely all meeting together in person. CodePen is one of the largest communities for web designers and developers to showcase their coding skills, with an estimated 330,000 registered users and 16.9 million monthly visitors.
CodePen is free online service and I personally use codepen for all my quick web snippets. The premium account has additional features, but these premium features are not required for our tutorial.
Creating your First Pen
Once you have created and validated your account, you will now be able to create web snippets online, called Pens, so let us get started by going to Create (top left-hand corner) and selecting Pen. This will open the online editor which consists of:
- HTML Editor – This is where your HTML goes, the structure of your web page.
- CSS Editor – This is where you place your Cascading Style Sheets (CSS) code that defines the look-and-feel of your web page.
- JS Editor – This is where you place your JavaScript Code to add functionality to your web page.
- Settings – This opens the settings menu where you can add your external CSS files, JavaScript libraries, define preprocessors and behaviour of your pen.
Note: Do not forget to give your pen a title at the top left-hand corner of the screen. Also remember, that by using a free account your Pens are public so anyone can view them; for snippets this should not be an issue.
Let us set up our external libraries and dependencies:
- Click on Settings.
- Click on CSS.
- In the Add External Stylesheets/Pens search, type in twitter-bootstrap and click on the results to add this library to your pen. As of this article, we added Bootstrap 4.1.3.
- Click on JavaScript.
- In the Add External Script/Pens search, type in jQuery and add this to your pen. As of this article, we added jQuery 3.3.1.
- In one of the empty boxes, copy and paste in the following: https://public.tableau.com/javascripts/api/tableau-2.2.2.min.js. This will add the Tableau JavaScript library to your pen.
and that is it, we have configured as much as we need to, so we can now start using the Tableau JavaScript API to embed a Tableau Public Dashboard.
Embedding a Tableau Visualisation
Let us start by entering the following into our HTML Editor:
<div class="buttons">
  <button class="apply_RegionFilter btn" style="background-color: #a8dba2; ">Europe</button>
  <button class="apply_RegionFilter btn" style="background-color: #f5a8a3; ">Middle East</button>
  <button class="apply_RegionFilter btn" style="background-color: #afc8e3; ">The Americas</button>
  <button class="apply_RegionFilter btn" style="background-color: #d0bde0; ">Oceania</button>
  <button class="apply_RegionFilter btn" style="background-color: #ffc898; ">Asia</button>
  <button class="apply_RegionFilter btn" style="background-color: #cdb2ac; ">Africa</button>
  <button class="selectAll_RegionFilter btn btn-outline">All</button>
</div>
<div id="tableauViz"></div>
Here we are:
- Creating several buttons using the Bootstrap btn class.
- Setting the color of the buttons to match the colors of the data visualisation.
- Creating an empty div with an id of tableauViz.
Now let us add a little custom style by adding the following
.btn {
  margin: 5px;
}
Note the most exciting piece of code, but we are giving our buttons a little margins.
Finally, let us enter the following into our JS Editor:
$( document ).ready(function() {
  var viz, workbook, activeSheet;
  var placeholderDiv = document.getElementById("tableauViz");

  var url = "https://public.tableau.com/views/WorldIndicators/GDPpercapita";
  var options = {
    width: "100%",
    height: "600px",
    hideTabs: true,
    hideToolbar: true,
    onFirstInteractive: function () {
      workbook = viz.getWorkbook();
      activeSheet = workbook.getActiveSheet();
    }
  };
  viz = new tableau.Viz(placeholderDiv, url, options);

  $(".apply_RegionFilter").click(function() {
    activeSheet.applyFilterAsync(
      "Region",
      $(this).text(),
      tableau.FilterUpdateType.REPLACE);
  });

  $(".selectAll_RegionFilter").click(function() {
    activeSheet.clearFilterAsync("Region");
  });
});
Now let us go into this a little:
- The $(document).ready() is from jQuery and executes the code once the document object model (DOM) has been loaded and ready for manipulation.
- The document.getElementById(“tableauViz”) returns the div element within the HTML, we will place our Tableau Visualisation here.
- We set our
url variable to point to a Tableau Public Visualisation, this one is used in the official Tableau JavaScript API tutorial, so why not reuse. - We set our options variable that describes how our visualisation will be rendered. You have a full list of options here: https://onlinehelp.tableau.com/current/api/js_api/en-us/JavaScriptAPI/js_api_ref.htm, search for VizCreateOptions.
- We then call new tableau.Viz(placeholderDiv,
url , options) which creates the Tableau Visualisation specified in URL, with the specified options, and where the div id is tableauViz. - The $(“.apply_RegionFilter”).click() sets an action for the buttons with the apply_RegionFilter class. This action takes the text of the button and applies this as a filter on Region.
- The $(“.selectAll_RegionFilter”).click() sets an action for the button with the selectAll_RegionFilter class. This action clears the filter selections.
If everything is done correctly, you should now see something like the following:
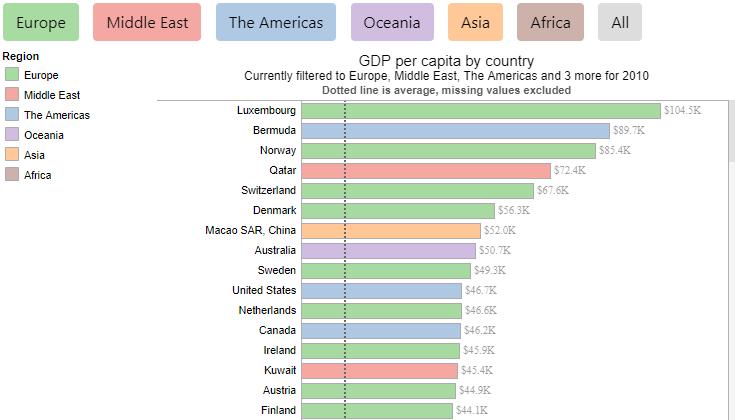
and boom, you are done, you should be able to click on the buttons and interact with the embedded Tableau Visualization. This tutorial is meant to be an introduction and there are quite a lot of cool things that you can do with the JavaScript API, so please do explore, or wait for my next article, either way, I hope this got you excited, however, with the JavaScript API you can also:
- Move between tabs.
- Select marks.
- Select sheets.
- Listen for events.
- Access the toolbar functionality.
My Pen can be found here: https://codepen.io/thoang1000/pen/XobNma
Summary
In this tutorial, we have covered a large amount of ground. We looked at:
- Setting up our codepen account.
- Creating a Pen and adding several libraries:
- Bootstrap for the look and feel of the component.
- jQuery to interact with our HTML.
- Tableau API library.
- Created our first Pen and Javascript API application that:
- Embedding a Tableau Public visualisation into a Web Page.
- Setting the options for the visualisation.
- Applying filters to the visualisation.
I hope you all enjoyed this article as much as I enjoyed writing it. Do let me know if you experienced any issues getting up and running, and as always, please leave a comment below or reach out to me on Twitter @Tableau_Magic.
Read more about Tableau JavaScript API on the official website: https://onlinehelp.tableau.com/current/api/js_api/en-us/JavaScriptAPI/js_api_whats_new.htm
If you like our work, do consider supporting us on Patreon, and for supporting us, we will give you early access to tutorials, exclusive videos, as well as access to current and future courses on Udemy:
- Patreon: https://www.patreon.com/tableaumagic
Also, do be sure to check out our various courses:
- Creating Bespoke Data Visualizations (Udemy)
- Introduction to Tableau (Online Instructor-Led)
- Advanced Calculations (Online Instructor-Led)
- Creating Bespoke Data Visualizations (Online Instructor-Led)


