Dual-Metric Doughnut Chart Tutorial
I created this data visualisation in Tableau when I was exploring Sunburst charts, and drawing polygons, but never did release an article on it. But given I just finished my article...
Tableau Magic on Udemy
After months of planning, endless preparation, and loads of refilming, I am finally ready to make public my first Udemy Course on Creating Bespoke Data Visualisations in Tableau. Since starting Tableau...
Tableau UI / An Introduction
Tableau UI is a React component library containing UI components for building web applications with the Tableau look-and-feel. In this introductory tutorial, we will set up our development environment (and relevant...
Creating Gradient Radial Bar Charts in Tableau
This is an update to one of my original Tableau Tutorials, here is a tutorial for creating Gradient Radial Bar Charts in Tableau; I hope you enjoy this and pick up...
Creating Pointed Podium Bar Charts in Tableau
A few weeks ago I created a tutorial for making a Podium Bar Chart. This week we are going to draw a Point Podium Bar Chart in Tableau using Polygons. I...
Creating Floating Bar Charts with Shaped Background
I have seen some amazing data visualisations using floating Worksheets, but a student asked me if we can create a floating bar chart effect in Tableau, so here we have it,...
Creating Gauges in Tableau
Another Tableau Tutorial request. Here is a tutorial on creating Gauges in Tableau. In this tutorial, we are going to show the colour-coded percentage out of 100.Note: This is an alternative...
Creating Gradient Backgrounds in Tableau
When I created my Cryptocurrency Dashboard, I decided to have some fun with gradient backgrounds. When combined with animations, this creates a very cool effect, so here you go, a nice...
Drawing Daisy Charts in Tableau
On my way home from the London Tableau User Group (TUG) I was looking at Twitter and got inspiration from Kevin Flerlage (@FlerlageKev) and Rajeev Pandey (@rajvivan), so I thought I...
Arc Chart Tutorial
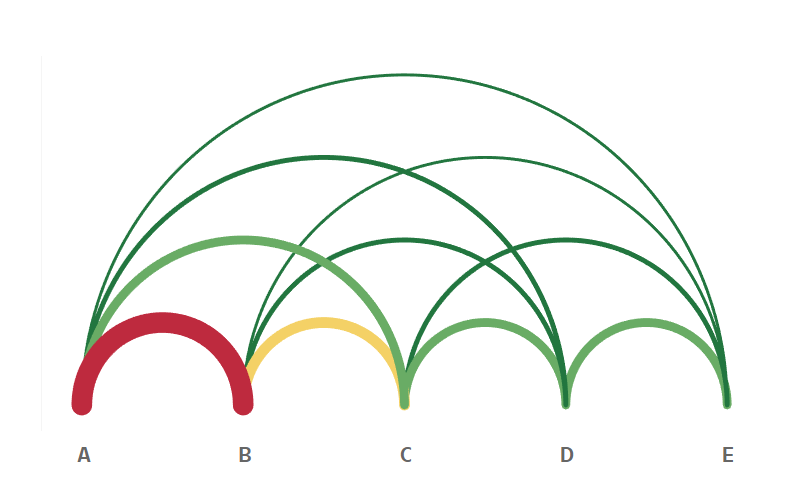
After years of using Tableau, I was finally given a use case that would allow me to create an Arc Chart; I always strive to build the best visualization for the client’s requirements. The client wanted to visualize...


