Creating Half Circle Gauge Charts in Tableau
Requested from a friend, here is a nice and simple tutorial on creating Half Circle Gauge Charts in Tableau. In this tutorial, we are going to show the colour-coded percentage out...
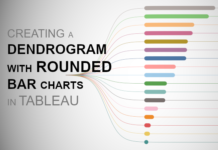
Creating Dendrogram with Rounded Bar Charts in Tableau
I am really having a fun moment with Dendrogram Charts, and in this tutorial, we are going to combine a Dendrogram Chart with Rounded Bar Charts to create a very nice...
Tableau’s JavaScript API / An Introduction
In the past 5 years, I have been programming a lot with JavaScript, from simple jQuery to Angular to React. This has been mainly for my personal projects and surprisingly I have...
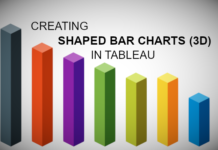
Shaped Bar Charts (3D) in Tableau
We previously had an article about creating Shaped Bar Charts in Tableau; in that previous tutorial, we used data densification to create a different look and feel for our bar charts....
Tableau and R / An Introduction
One of the Tableau topics I am frequently asked is can we integrate Tableau with the R programming language for statistical computation? The answer is yes, Tableau can be integrated with...
Creating Gradient Backgrounds in Tableau
When I created my Cryptocurrency Dashboard, I decided to have some fun with gradient backgrounds. When combined with animations, this creates a very cool effect, so here you go, a nice...
Gauge Chart (With Arrow)
As of the time of this article, I am a two-time Tableau Zen Master, and, as such, I am afforded several different types of opportunities from Tableau. One such opportunity is...
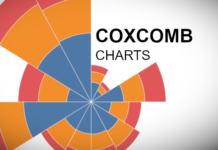
Creating a Coxcomb Chart in Tableau
I had this one on my radar for so long now, literally, ever since I ventured in Bespoke Data Visualisations in Tableau. A student requested this tutorial, so I thought I...
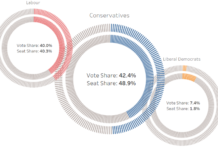
Double, Spaced Doughnut Chart Tutorial
After the United Kingdom 2017 General Election, on Thursday 8th June 2017, I had many conservations about our First Past The Post system (FPTP), and why we do not have a Proportional...
Creating Circular KPIs in Tableau
After the Barcelona vs Bayern Munich Semi-Finals for the Champions League 2020, I was browsing Twitter to see reactions and saw a circular KPI visualisation and thought that I would create...


