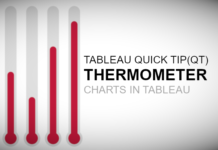
Tableau QT: Thermometer Chart
This is a Quick Tip on how to build a Thermometer Chart in Tableau, so less reading and more jumping in. We are going to spend 5 minutes or less building...
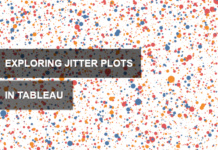
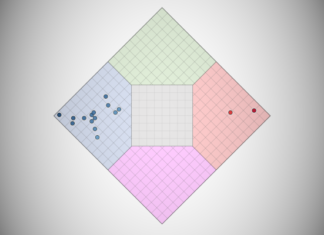
Exploring Jitter Plots in Tableau
Sometimes you read something and you just want to have fun, so therefore, I decided to write a short blog to introduce the RANDOM() function in Tableau and to use this...
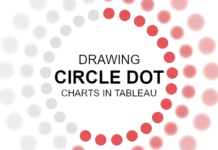
Drawing a Circle Dot Chart
I saw the following while looking for inspiration and thought that this would be fun to build, to build this visualisation as well as to include some neat variations. This should...
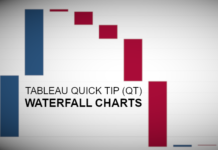
Tableau QT: Waterfall Chart
This is a Quick Tip on how to build a Waterfall Chart in Tableau, so less reading and more jumping in. We are going to spend 5 minutes or less building...
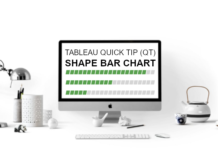
Tableau QT: Shape Bar Chart
This is a Quick Tip on how to build a Shape Bar Chart in Tableau, so less reading and more jumping in. We are going to spend 5 minutes or less...
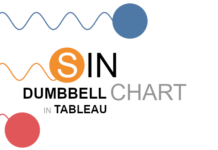
Tableau QT: Sin-Dumbbell Chart
This is a Quick Tip on how to build a Sin-Dumbbell Chart in Tableau, so less reading and more jumping in. We are going to spend 5 minutes or less building...
Tableau QT: League Table
This is a Quick Tip on how to build a League Table in Tableau, so less reading and more jumping in. We are going to spend 5 minutes or less building...
Drawing a WiFi Symbol
I do like having some fun with Tableau and in this blog we are going to use Data Densification to draw a simple WiFi Symbol. This will be quick, fun and...
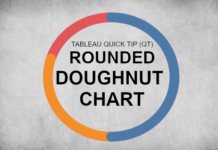
Tableau QT: Rounded Doughnut Chart
This is a Quick Tip on how to build a Rounded Doughnut Chart in Tableau, so less reading and more jumping in. We are going to spend 5 minutes or less...
Tableau QT: Funnel Chart
This is a Quick Tip on how to build a Funnel Chart in Tableau, so less reading and more jumping in. We are going to spend 5 minutes or less building...


