Tableau Application Programming Interfaces (APIs)
Tableau has an ever-growing list of Application Programming Interfaces (APIs) that we as developers can leverage to add functionality to Tableau; personally speaking, this is the most exciting part of the...
TAB105 / Exploring Marks
In the fifth part of our introduction to Tableau Series, we are going to look at the Mark Shelf, Mark Types and how to customize the appearance of your Marks within...
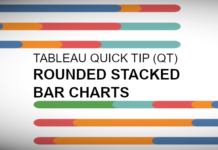
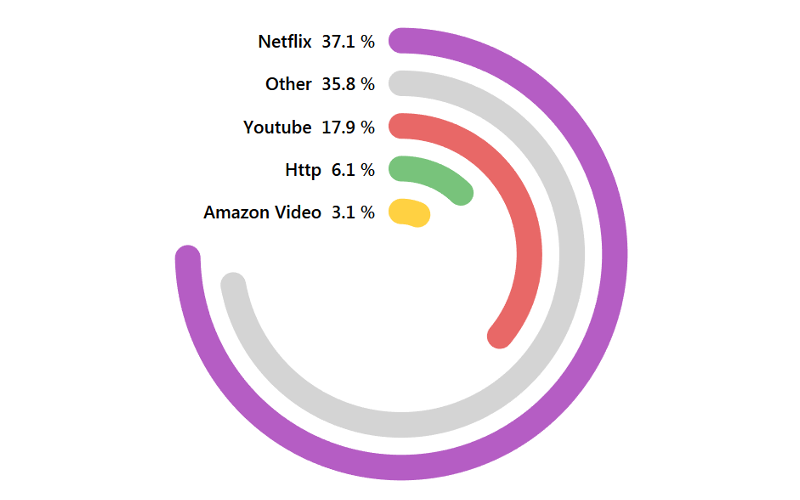
Tableau QT: Rounded Stacked Bar Charts in Tableau
This is a Quick Tip on how to build Rounded Stacked Bar Charts in Tableau, so less reading and more jumping in. We are going to spend 5 minutes or less...
Tableau 2019.3: Distance Function
Tableau 2019.3 was released on Tuesday 17th September 2019 and comes with some very (very) nice features. In this article, we are going to spend the next 10 minutes to look...
SQL101 / Relational Database Management Systems
A lot of SQL tutorials go through the ins and outs of writing SQL Statements, however, I wanted to do something slightly different and more comprehensive in this tutorial set. I...
Tableau QT: Podium Bar Chart
Thinking about the olympics and podiums, so here is a Tableau Quick Tip on Creating a Podium Bar Chart within 10 minutes or less.
Note: This is an alternative type of data...
SQL104 / Table Joins
Now that we have installed a SQL Server Express Database, SQL Server Management Studio (SSMS), AdventureWorks, can create a SQL SELECT Statements and in our last chapter, we learned about data...
Sin Function
In mathematics, the sine is a trigonometric function of an angle. The sine of an acute angle is defined in the context of a right triangle: for the specified angle, it...
Color Palette Generator by Tableau Magic
Color Palette Generator by Tableau Magic, our first and free Utility for Tableau.
Hex Maps in Tableau
I have always had a thing for Hex Maps, so I decided to finally write a tutorial on how you can generate some very interesting Hex Maps. With the help of...


