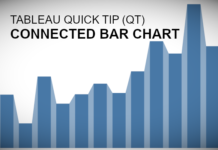
Tableau QT: Connected Bar Charts
This is a Quick Tip on how to build a Connected Bar Charts in Tableau, so less reading and more jumping in. We are going to spend 5 minutes or less...
Tableau QT: Spiral Charts
This is a Quick Tip on how to build a Spiral Chart in Tableau, so less reading and more jumping in. We are going to spend 5 minutes or less building...
Tableau QT: Pyramid Step Chart
This is a Quick Tip on how to build a Pyramid Step Chart in Tableau, so less reading and more jumping in. We are going to spend 5 minutes or less...
Tableau QT: Thermometer Chart
This is a Quick Tip on how to build a Thermometer Chart in Tableau, so less reading and more jumping in. We are going to spend 5 minutes or less building...
Exploring Jitter Plots in Tableau
Sometimes you read something and you just want to have fun, so therefore, I decided to write a short blog to introduce the RANDOM() function in Tableau and to use this...
Tableau QT: Shape Bar Chart
This is a Quick Tip on how to build a Shape Bar Chart in Tableau, so less reading and more jumping in. We are going to spend 5 minutes or less...
Tableau QT: Sin-Dumbbell Chart
This is a Quick Tip on how to build a Sin-Dumbbell Chart in Tableau, so less reading and more jumping in. We are going to spend 5 minutes or less building...
Tableau QT: League Table
This is a Quick Tip on how to build a League Table in Tableau, so less reading and more jumping in. We are going to spend 5 minutes or less building...
Tableau QT: Rounded Doughnut Chart
This is a Quick Tip on how to build a Rounded Doughnut Chart in Tableau, so less reading and more jumping in. We are going to spend 5 minutes or less...
Tableau QT: Funnel Chart
This is a Quick Tip on how to build a Funnel Chart in Tableau, so less reading and more jumping in. We are going to spend 5 minutes or less building...


