


")


Yes, I have been experimenting with Jitter Plots recently, and created the following Circular Jitter Plot in Tableau; this type of chart does create a distinct and unique look, so I hope you have fun with this data visualisation.
Note: This is an alternative type of data visualisation, and sometimes pushed for by clients. Please always look at best practices for data visualisations before deploying this into production.
Version: This tutorial was created in Tableau Desktop 2019.2.
Data
Load the following data into Tableau Desktop / Public.
Note: The following is orders tab of the Tableau provided Sample – EU Superstore.xls
Calculated Fields
With our data set loaded into Tableau, we are going to create the following Calculated Fields:
Index
INDEX()-1Random
RANDOM()Note: RANDOM() is an undocumented function, so this should not be used for production reporting, but definitely for fun.
X
SIN(RADIANS([Index]))*[Random]Y
COS(RADIANS([Index]))*[Random]Yep, not too many Calculated Fields, but we will not build our worksheet.
Worksheet
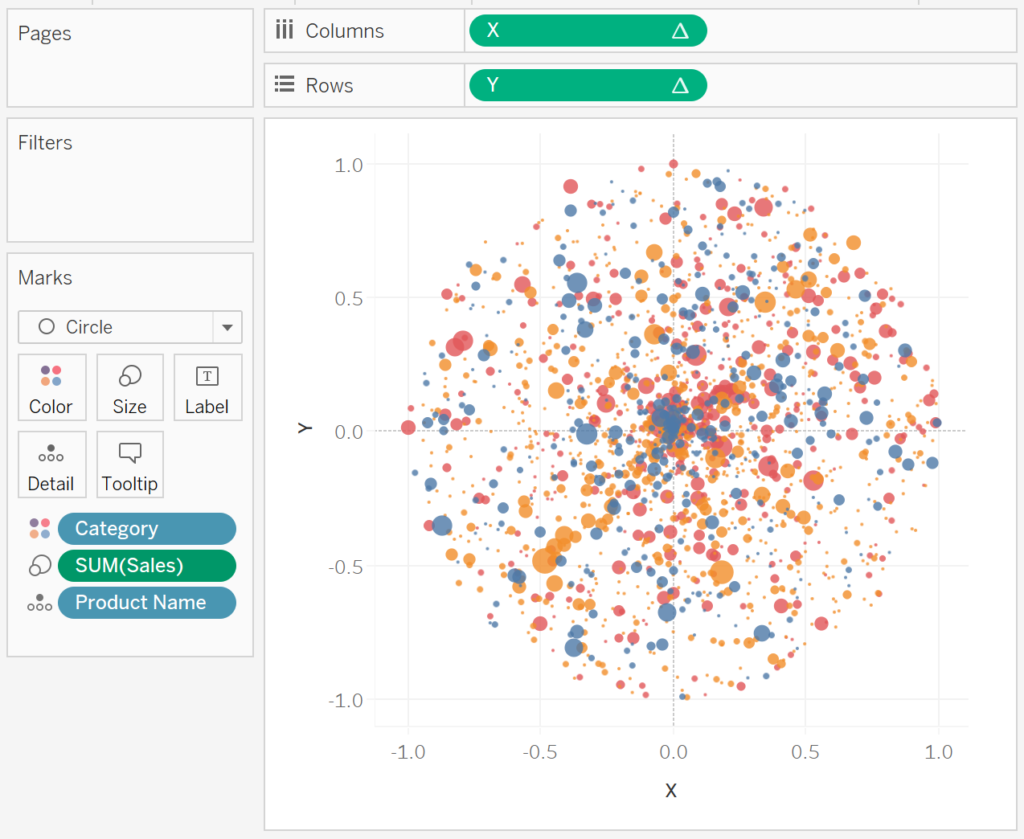
We will now build our first worksheet:
- Change the Mark Type to Circle.
- Drag Category to Color.
- Drag Product Name to Detail.
- Drag Sales onto Size.
- Drag X onto Columns.
- Right-click on the object, go to Compute Using and Select Product Name.
- Drag Y onto Rows.
- Right-click on the object, go to Compute Using and Select Product Name.
If all goes well, you should end up with the following:
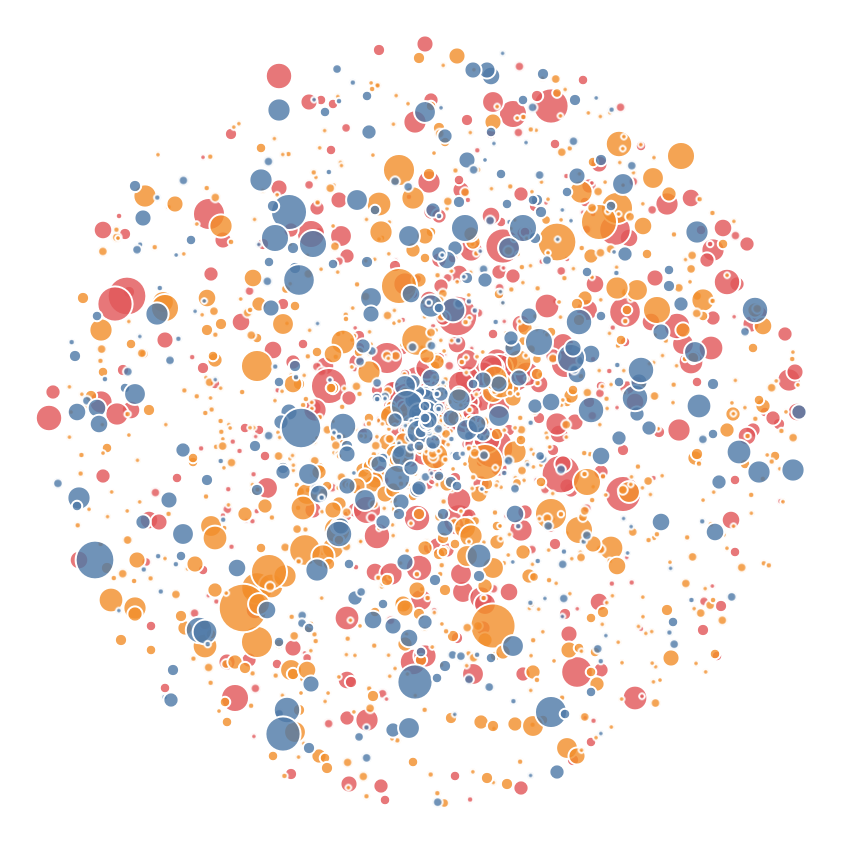
Now we will edit the cosmetics of your visualisation.
- Hide the Grid Lines.
- Hide the Zero Lines.
- Hide the Y Axis Header.
- Hide the X Axis Header.
- Set the Color Transparency to 80%.
- Give a White Outline.
- Update the Tooltip.
- Edit the Size.
You want to see the following:
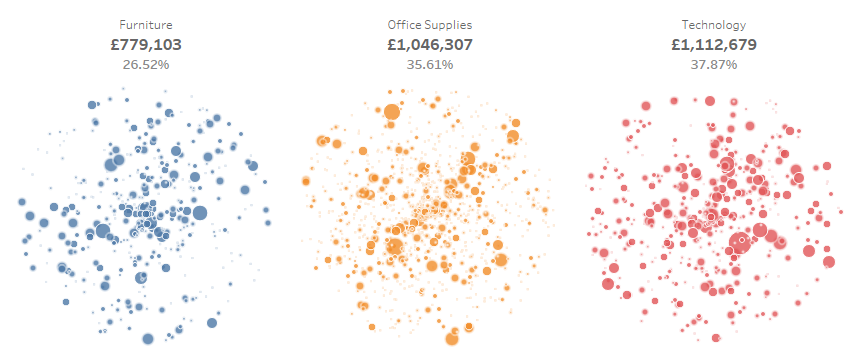
Variation 1
Drag Category onto Columns, add some additional information to have the following:
Variation 2
Edit the Random function to be:
RANDOM()+0.5You should see the following:

Variation 3
Edit the Index function to be:
(INDEX()-1)%270You should see the following:
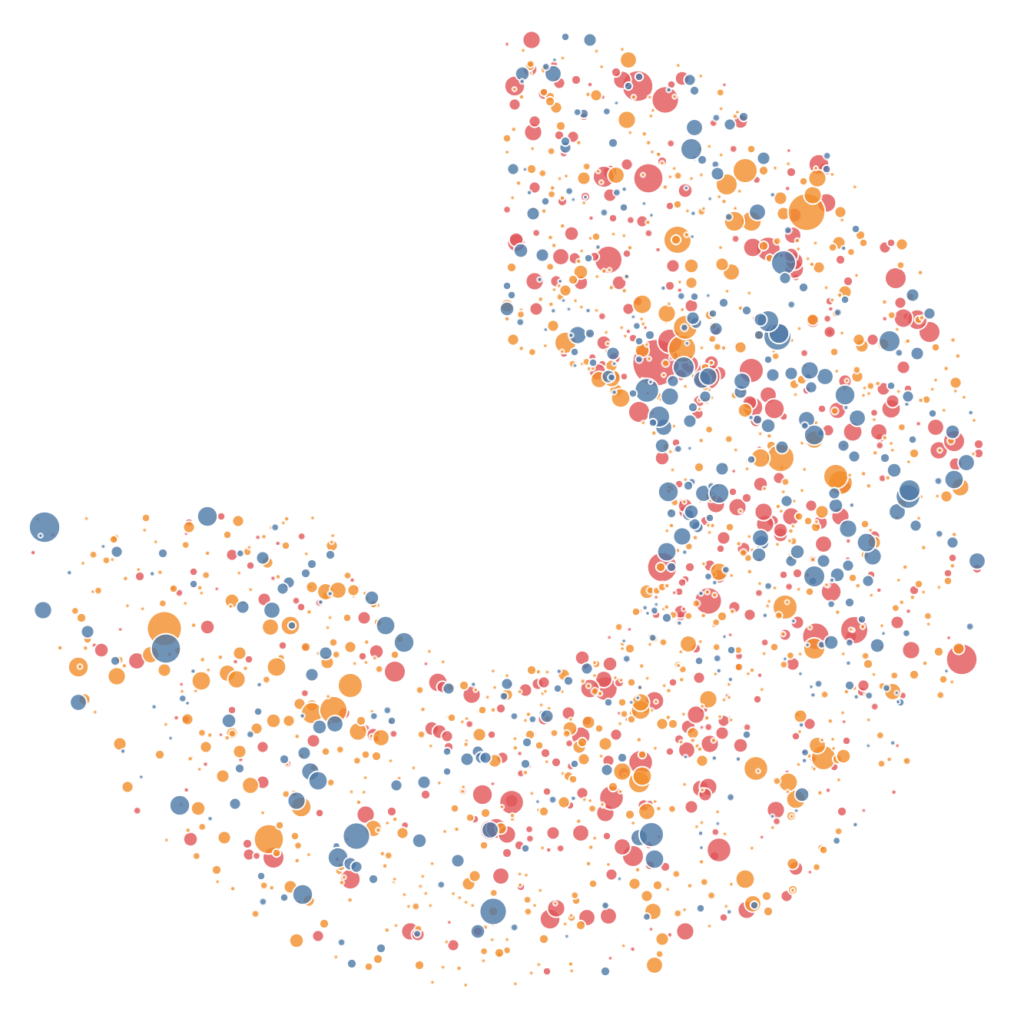
Variation 4
Now we are just going to get silly…
Change Index to:
(INDEX()-1)%360Change Random back to:
RANDOM()Now we will update our visualisation:
- Drag Index onto Column and drop it onto of X to replace.
- Right-click on the object, go to Compute Using and select Product Name.
- Drag X onto Rows and drop it onto of Y to replace.
- Right-click on the object, go to Compute Using and select Product Name.
You should see the following:
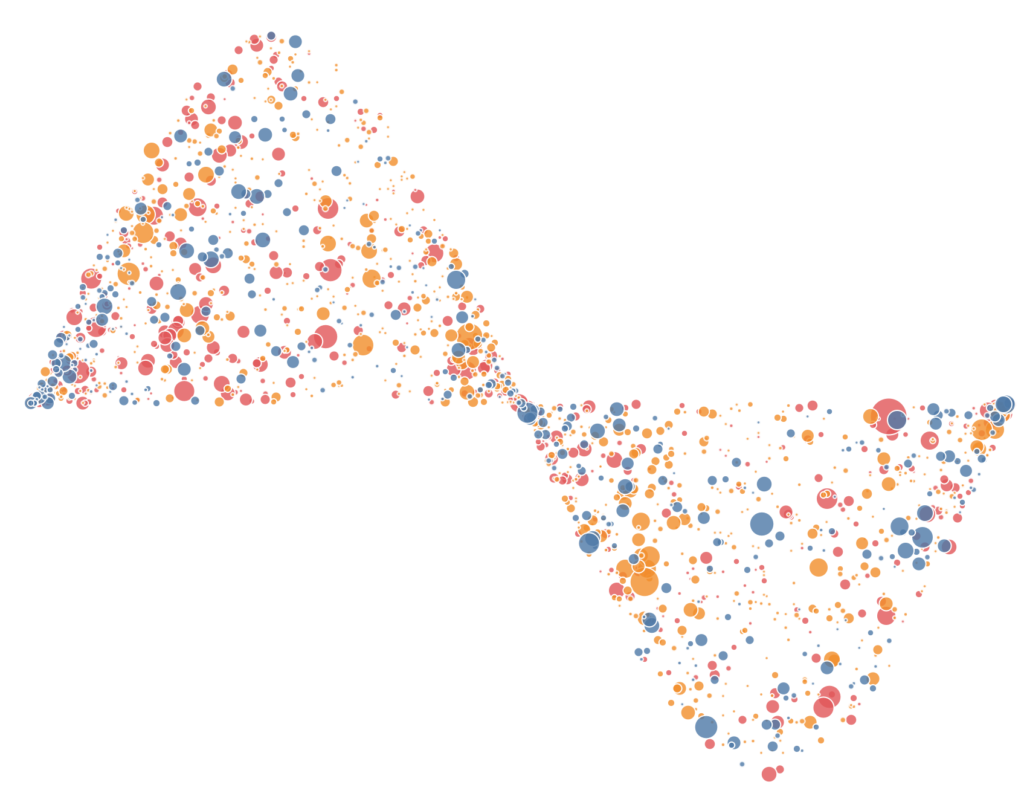
Yep, we have put a Jitter Plot underneath a Sin Curve; fun huh… and with that, we are done with our Jitter plots. I really like this type of visualisation and will experiment further. You can find my version on Tableau Public here:
https://public.tableau.com/profile/toan.hoang#!/vizhome/CircularJitterPlot/CircularJitterPlot
Summary
I hope you all enjoyed this article as much as I enjoyed writing it and as always do share the love. Do let me know if you experienced any issues recreating this Visualisation, and as always, please leave a comment below or reach out to me on Twitter @Tableau_Magic.
If you like our work, do consider supporting us on Patreon, and for supporting us, we will give you early access to tutorials, exclusive videos, as well as access to current and future courses on Udemy:
- Patreon: https://www.patreon.com/tableaumagic
Also, do be sure to check out our various courses:
- Creating Bespoke Data Visualizations (Udemy)
- Introduction to Tableau (Online Instructor-Led)
- Advanced Calculations (Online Instructor-Led)
- Creating Bespoke Data Visualizations (Online Instructor-Led)

 Table Calculation")


Hi Toan,
The Orders txt file contains many null values, I think data is not complete, could you please check and update me.
I will double check, but it should be fine, if you have Tableau Desktop, you can use the EU Superstore.
Thx Toan, will check with EU Superstore
For some reason, I am able to recreate what you’ve done using the same data source (EU Superstore), but if I try to do it using any other data source, I don’t get a nice circle shape.
Can you send me a screenshot to admin@tableau.toanhoang.com
Hey Toan, I was able to find a dataset it worked on. Interestingly, It works on any dataset I have with 1000+ cases, but doesn’t work on ones with less than 200 cases.
That is very interesting, I will pencil in sometime later this week to look into this.
Thank you Toan again for the wonderful Article.
Say If I want to use this visualization in Production report’s, could you me help me how we can interrupt this?
If you have a good use case for this, I can try to help you. Send me an email to admin@tableau.toanhoang.com and we can discuss offline.
Hi Toan, Thanks for the blog. I tried creating this shape which worked well for a couple of categories, but for few of them, it is not going full circle. The data is enough to build a full circle but it somehow stops at about 240 degrees. Any pointers would be appreciated. Thanks.
Hi Iram, if you can, please send me a test data set to admin@tableau.toanhoang.com, and I will have a look at it.
Hi Iram and Toan, am facing the same problem with the non full circle, is there a solution for this?
I have a problems building the circle jitter plot.
My chart not show in circle. How can I fix it, please.