
I love experimenting with Tableau and I wanted to revisit my formal education and explore how we might be able to draw a Bezier Curve in Tableau. Although I have no real-world application for this at the moment, I thought it would be good to share this with you, so maybe one of you can take this one step further.
Note: This is an alternative type of data visualisation, and sometimes pushed for by clients. Please always look at best practices for data visualisations before deploying this into production.
Data
We will start by loading the following data into Tableau Desktop / Tableau Public.
Path,Point 1.x,Point 1.y,Point 2.x,Point 2.y,Point 3.x,Point 3.y,Point 4.x,Point 4.y
0,10,10,50,120,150,200,200,70
1,10,10,50,120,150,200,200,70
Rename this Data Source to Curve
Note: This code defines the X and Y coordinates for four individual points and provides two lines so that we can do a little data densification.
We will also load an additional data source into Tableau.
Point,X,Y
1,10,10
2,50,120
3,150,200
4,200,70
Rename this Data Source to Points
Note: As you can see the second data source contains the same data as the first, but we have formatted this in a different way to make things a lot easier; I am sure that I would have used a single data source, but that would have required a lot of work in the already complex calculations.
Calculated Fields
With our two data sources loaded into Tableau, in the Curve Data Source we are going to create the following Calculated Fields:
Path (bin)
- Right-click on Path, go to Create and select Bins…
- In the Edit Bins dialogue window:
- Set New field name to Path (bin)
- Set Size of bins to 0.1
- Click Ok
Index
(INDEX()-1)/100aX
3 * (WINDOW_MAX(MAX([Point 2.x]))-WINDOW_MAX(MAX([Point 1.x])))bX
( 3 * (WINDOW_MAX(MAX([Point 3.x]))-WINDOW_MAX(MAX([Point 2.x])))) - [aX]cX
WINDOW_MAX(MAX([Point 4.x])) - WINDOW_MAX(MAX([Point 1.x])) - [aX] - [bX]aY
3 * (WINDOW_MAX(MAX([Point 2.y]))-WINDOW_MAX(MAX([Point 1.y])))bY
( 3 * (WINDOW_MAX(MAX([Point 3.y]))-WINDOW_MAX(MAX([Point 2.y])))) - [aY]cY
WINDOW_MAX(MAX([Point 4.y])) - WINDOW_MAX(MAX([Point 1.y])) - [aY] - [bY]X-Axis Calculation
([cX] * POWER([Index],3)) + ([bX] * POWER([Index],2)) + ([aX] * [Index]) + WINDOW_MAX(MAX([Point 1.x]))Y-Axis Calculation
([cY] * POWER([Index],3)) + ([bY] * POWER([Index],2)) + ([aY] * [Index]) + WINDOW_MAX(MAX([Point 1.y]))Note: as you can see, we have created several calculations to make this Bezier Curve, you can find additional information on the mathematics behind a Bezier Curve on Wikipedia Here.
With this done, let us start creating our data visualisation.
Worksheet
We will now build a two worksheets:
- Using the Curve Data Source
- Change the Mark Type to Line
- Drag Path (bin) onto the Columns Shelf
- Right-click on this pill and ensure that Show Missing Values is selected
- Drag this pill onto the Path Mark
- Drag X-Axis Calculation onto the Columns Shelf
- Right-click on this pill, go to Compute Using and select Path (bin)
- Drag Y-Axis Calculation onto the Rows Shelf
- Right-click on this pill, go to Compute Using and select Path (bin)
If all goes well, you should see the following:


We will not adjust the formatting of this data visualisation:
- Hide the Row and Column Dividers
- Hide the Grid Lines
- Hide the Zero Lines
- Double-click on the Y-Axis Header and fix the Y-Axis to -10 to 220
- Double-click on the X-Axis Header and fix the X-Axis to -10 to 220
- Hide the X-Axis and Y-Axis Headers
- Set the Worksheet Background colour to None
We will now have the following:

Now we will create an additional Worksheet.
- Click on the New Worksheet
- Using the Points Data Source
- Change the Mark Type to Circle
- Drag Point onto the Label Mark
- Drag X onto the Columns Shelf
- Right-click on this pill and convert to a Dimension
- Drag Y onto the Rows Shelf
- Right-click on this pill and convert to a Dimension
- With your finger on Ctrl (or Command) Drag-and-Drop to the X-pill on the Columns Shelf to the right (this will duplicate the pill)
- On the X (2) Marks Panel
- Change the Mark Type to Line
- Drag Point from the Label Mark to Path Mark
You should now see the following:

We will now adjust the cosmetics of this Worksheet:
- Right-click on the second X-pill and select Dual Axis
- Right-click on the X-Axis Header and select Synchronize Axis
- On the X (2) Marks Panel
- Click on the Size Mark and reduce to the smallest possible
- Click on the Color Mark and select a shade of Grey
- On the X Marks Panel
- Click on the Size Mark and adjust the size to the halfway mark
- Click on the Label Mark and set the Horizontal and Vertical Alignment to Centre
- Click on the Color Mark and set the Color to Black
- Hide the Row and Column Dividers
- Hide the Grid Lines
- Hide the Zero Lines
- Double-click on the Y-Axis Header and fix the Y-Axis to -10 to 220
- Double-click on the X-Axis Header and fix the X-Axis to -10 to 220
- Hide the X-Axis and Y-Axis Headers
- Set the Worksheet Background colour to None
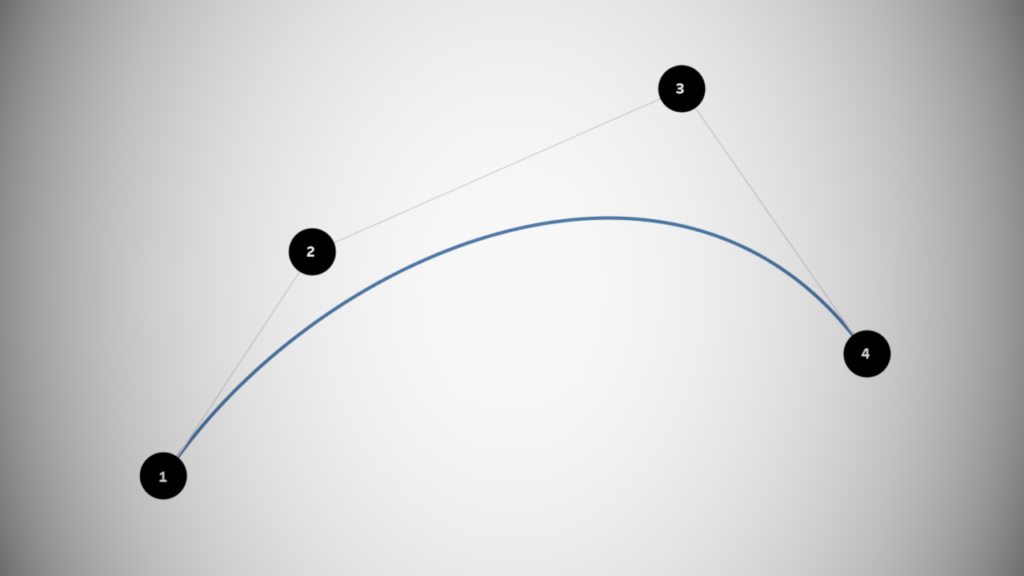
You should now have the following:

All we need to do now is to create a dashboard, and with Float selected, drag both Worksheets onto the Dashboard and align on top of each other, you will want to end up with the following:

and boom, we are done! I hope you enjoyed creating this data visualization and learned some cool techniques as well. As always, you can find this data visualisation on Tableau Public at https://public.tableau.com/profile/toan.hoang#!/vizhome/BezierCurve/BezierCurve
Note: this is highly experimental and is fixed for four points. I am investigating a way to make this more dynamic, so hopefully by the time you read this, I would have figured this out.
Summary
I hope you all enjoyed this article as much as I enjoyed writing it and as always do share the love. Do let me know if you experienced any issues recreating this Visualization, and as always, please leave a comment below or reach out to me on Twitter @Tableau_Magic. Do also remember to tag me in your work if you use this tutorial.
If you like our work, do consider supporting us on Patreon, and for supporting us, we will give you early access to tutorials, exclusive videos, as well as access to current and future courses on Udemy: https://www.patreon.com/tableaumagic