Creating Circular KPIs in Tableau
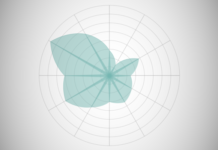
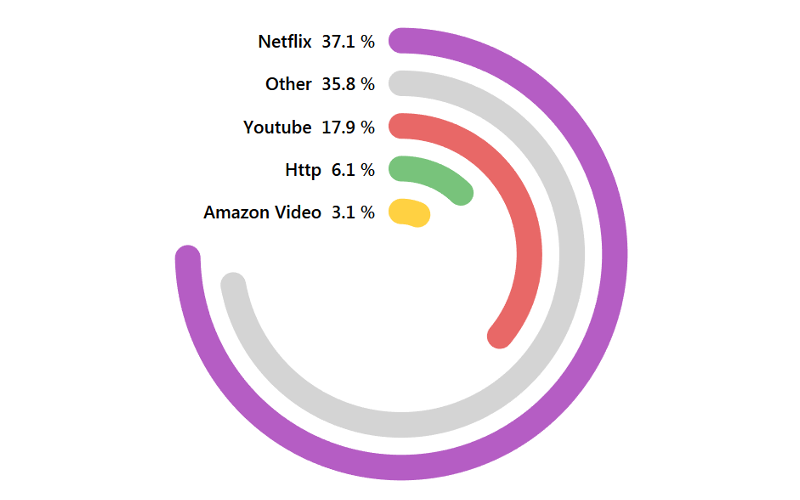
After the Barcelona vs Bayern Munich Semi-Finals for the Champions League 2020, I was browsing Twitter to see reactions and saw a circular KPI visualisation and thought that I would create...
Single Level Sankey Diagram
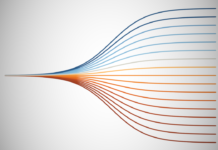
I saw this data visualisation while being a judge for #IronViz and thought that I should add this to my library of cool and interesting data visualisations. I hope you enjoy...
Video: Tableau with Music / Filled Circle
Using a few neat tricks and some Table Calculations, we have created this awesome chart in Tableau. Enjoy.
https://www.youtube.com/watch?v=IYU48oc7-dU
Written Tutorial
YouTube Channel
Video: Tableau with Music / Dendrogram with Rounded Bar Charts
Using a few neat tricks and some Table Calculations, we have created this awesome chart in Tableau. Enjoy.
https://youtu.be/ywH3qFD9UNI
Written Tutorial
YouTube Channel
Creating Curved Polar Chart in Tableau
Just for a little bit of fun before I take a month off blogging, yep, we all need a little break fro time to time, I decided to have some fun...
Video: Tableau with Music / Single Level Dendrogram
Using a few neat tricks and some Table Calculations, we have created this awesome chart in Tableau. Enjoy.
https://youtu.be/AYeb8rb_FZA
Written Tutorial
YouTube Channel
Creating a Polar Chart in Tableau
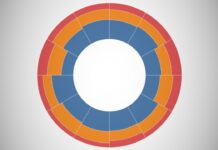
As we close down our second set of tutorials in 2020, I wanted to finally have some fun with Polar Charts, so here you have it, something that is often asked...
Video: Tableau with Music / Radial Stacked Bar Charts
Using a few neat tricks and some Table Calculations, we have created this awesome chart in Tableau. Enjoy.
https://youtu.be/r5TgiLyHe4A
Written Tutorial
YouTube Channel
Create a Radial Column Chart (Variation)
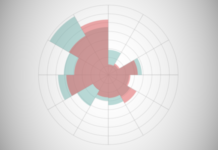
I wanted to have some fun and build up a Polar Chart, however, I had an accident and decided to run with it, and this is the resulting data visualisation. I...
Video: Tableau with Music / Bar Trend Chart
Using a few neat tricks and some Table Calculations, we have created this awesome chart in Tableau. Enjoy.
https://youtu.be/8nVY98Ouupg
Written Tutorial
YouTube Channel


