


")


Two weeks ago, I wrote part one of my four-part series in Creating a Tableau Extension / Part One where we introduced Git, GitHub, Yarn, Visual Studio Code as well as Bootstrap, jQuery and the Tableau Extension API library; sure, we only used the Tableau Extension API to list the data sources in a worksheet, but hey, we have to start somewhere. In part two, we are going to read the data from a Tableau worksheet and render using a popular open-source data visualisation library. So, are you excited? I am.
Part 2: Getting and Displaying Data
Before we get started we have to chat about the Tableau Extension API and Object-Oriented programming:
Object-oriented programming (OOP) is a programming paradigm based on the concept of “objects”, which may contain data, in the form of fields, often known as attributes; and code, in the form of procedures, often known as methods. A feature of objects is that an object’s procedures can access and often modify the data fields of the object with which they are associated (objects have a notion of “this” or “self”). In OOP, computer programs are designed by making them out of objects that interact with one another.
For those who have not programmed before it is important to keep in mind as the Tableau Extension API Library is object-oriented.
Application Programming Interface (API) is a set of subroutine definitions, communication protocols, and tools for building software. In general terms, it is a set of clearly defined methods of communication among various components. A good API makes it easier to develop a computer program by providing all the building blocks, which are then put together by the programmer.
Tableau Extension API is a set of subroutine definitions, communication protocols, and tools to build Tableau Extensions; Tableau Extensions are web applications that have two-way communication with the dashboard. Dashboard extensions enable all sorts of scenarios, like letting you integrate Tableau with custom applications, making possible for you to modify the data for a viz, or even creating custom visualizations inside the dashboard. A dashboard extension is just one type of extension that can be built using the Tableau Extensions API. You can read more about the Tableau Extension API here: https://tableau.github.io/extensions-api
Now that we have our definitions, we will start by building our project. Repetition is your friend, so we will build the project from Scratch.
Your Project
Note: that I am using Windows 10.
Let us start by setting up our project:
- Start Visual Studio Code.
- In the Terminal, navigate to your desired directory and create a directory using the mkdir command:
mkdir tableau-extensions-tutorial-part-two - Open your newly created directory within Visual Studio Code.
- Create a directory called js
- Create the following files (make sure both file names start if a period)
- .yarnrc
- Add the following line:
--modules-folder libs - This is where Yarn will save your third-party libraries
- Add the following line:
- .gitignore
- Add the following line:
/libs/ - This tells git to ignore the files within the libs directory. You should not be pushing your third-party libraries into your GitHub directory.
- Add the following line:
- .yarnrc
- In your terminal, make sure you are in the root directory:
- Enter the following command and press enter:
yarn init - Enter the following command and press enter:
yarn add jquery - Enter the following command and press enter:
yarn add bootstrap - Enter the following command and press enter:
yarn add chart.js - Check your libs folder and see that you should have extra stuff added.
- With those simple commands, you have added two of the most widely used web libraries to your project. As easy as that.
jQuery – jQuery is a lightweight, “write less, do more”, JavaScript library. The purpose of jQuery is to make it much easier to use JavaScript on your website. jQuery takes a lot of common tasks that require many lines of JavaScript code to accomplish and wraps them into methods that you can call with a single line of code.
Bootstrap – Bootstrap is a free and open-source front-end framework for designing websites and web applications. It contains HTML- and CSS-based design templates for typography, forms, buttons, navigation and other interface components, as well as optional JavaScript extensions. Unlike many earlier web frameworks, it concerns itself with front-end development only.
Chart.js – Simple, clean and engaging HTML5 based JavaScript charts. Chart.js is an easy way to include animated, interactive graphs on your website for free.
- Enter the following command and press enter:
Now let us get the Tableau Data Extensions API.
- Go to the Tableau Data Extension API website and download and save the latest file to your project js directory.
- Open the following in your web browser:
https://github.com/tableau/extensions-api/tree/master/lib - Right click and save the following:
tableau-extensions-1.0.0.min.js
- Open the following in your web browser:
Note: If anyone from Tableau is reading this, please add the Tableau Extension libraries to the Yarn repository. Pretty please.
Now let us start creating our Tableau Extension.
Extension
We will start by creating the Tableau extension manifest file (.trex) that contains metadata for the extension and is used for registration; the Tableau extension manifest file (.trex) contains the following information:
| Name of Element | Description |
| manifest | The root element that contains the manifest options. |
| manifest-version | The version of the manifest. The version currently supported is 0.1. |
| dashboard-extension | The root element that contains the options for the extension. The dashboard-extension includes the idattribute, which follows the reverse domain name pattern (com.example.extension), and extension-version number attribute. These attributes are required. |
| extension-version | The version of the extension. For example, extension-version="0.1.0" |
| default-locale | Specifies the default locale to use for localized text. Here both the locale format (en_US) and language code (en) are accepted. The default locale specified here is converted to one of the supported languages in the Tableau UI. If the language is unsupported or invalid, English is set as default. |
| name | The name of the extension as it appears under Extensions on a dashboard sheet. To provide localized text, specify the name of the resource-id and provide the text strings in the resources element of the manifest (see the manifest example). You can provide localized strings for name and description. |
| description | A short description of the extension. |
| author | Specifies metadata about the author of the extension, including name, email address, organization, and website. The name and website attributes are required. The website URL must use HTTPS. The website URL is the target of the Get Support link that users see in the About dialog box for your extension. The URL should take users to a page where they can learn about your extension and can get help on using it. |
| source-location | Contains the url of the server that hosts the web page you create that interacts with Tableau. |
| url | Specifies the scheme (HTTPS, HTTTP), the name of the server, the port (optional) and the path to extension (optional). The url must use HTTPS. For example: https://example.com/extension. The exception is for localhost. In this case, HTTP is allowed. For example: http://localhost:8080. |
| icon | If specified, the icon is what appears under Extensionson a dashboard sheet. The icon must be a 64×64 pixel PNG file that is Base64 encoded. If you need an encoder, see https://www.base64-image.de/ |
| permissions | Declares the types of permissions that this extension requires. The only option is full data. If your extension can access the underlying data or information about the data sources, you must declare full data permission in the manifest. Full data permissions are required if you use any one of the following APIs: Worksheet.getUnderlyingDataAsync(), Datasource.getUnderlyingDataAsync(), Datasource.getActiveTablesAsync(),Datasource.getConnectionSummariesAsync(). If your extension does not use one of these APIs, you do not need include permissions element. |
| context-menu | Adds a context menu item in the extension zone. This is a configuration feature that allows you to register a custom JavaScript callback function and associate it with a context menu item. The only allowed element in <context-menu> is <configure-context-menu-item />. The menu item and your configuration callback function are mapped together in the initializeAsync() function. When the extension is initialized, the menu item Configure… appears in the drop-down menu of the dashboard extension. When the user clicks the menu item, your callback function is executed. |
| resources | Specifies the resources that can be localized. |
| min-api-version | Specifies the minimum API version required to run the extension. |
Let us create our trex file for our Tableau Extension called TutorialTwo.trex:
<?xml version="1.0" encoding="utf-8"?>
<manifest manifest-version="0.1" xmlns="http://www.tableau.com/xml/extension_manifest">
  <dashboard-extension id="com.tableaumagic" extension-version="0.1.3">
    <default-locale>en_US</default-locale>
    <name resource-id=""/>
    <description>Tableau Data Extension Part Two</description>
    <author name="Your Name" email="Your Email" organization="Your Org" website="https://tableau.toanhoang.com"/>
    <min-api-version>0.9</min-api-version>
    <source-location>
      <url>http://localhost:8080</url>
    </source-location>
    <icon></icon>
    <permissions>
      <permission>full data</permission>
    </permissions>
  </dashboard-extension>
  <resources>
    <resource id="name">
      <text locale="en_US">Tutorial Two</text>
    </resource>
  </resources>
</manifest>
Let us create our skeleton HTML for our Tableau Extension called index.html:
<html>

<head>
    <link rel="stylesheet" type="text/css" href="libs/bootstrap/dist/css/bootstrap.min.css">
</head>

<body>
    <div class="wrapper">
        <canvas id="myChart" width="600" height="250"></canvas>
    </div>
</body>

<script type="text/javascript" src="libs/jquery/dist/jquery.min.js"></script>
<script type="text/javascript" src="libs/bootstrap/dist/js/bootstrap.min.js"></script>
<script type="text/javascript" src="libs/chart.js/dist/Chart.min.js"></script>
<script type="text/javascript" src="js/tableau-extensions-1.0.0.min.js"></script>
<script type="text/javascript" src="js/application.js"></script>
</html>
This is a very simple HTML that literally imports the libraries and puts a placeholder for our data visualisation, that is about it.
Now we are going to create a Javascript file that will draw a basic Chart.js bar chart where the <canvas id="myChart"></canvas> is; in the js folder create a file called application.js:
$(document).ready(function () {
   var ctx = $("#myChart");
   var myChart = new Chart(ctx, {
      type: 'doughnut',
      data: {
         labels: ["Africa", "Asia", "Europe", "Latin America", "North America"],
         datasets: [{
            label: "Population (millions)",
            backgroundColor: ["#3e95cd", "#8e5ea2","#3cba9f","#e8c3b9","#c45850"],
            data: [2478,5267,734,784,433]
         }]
      },
      options: {
         title: {
            display: true,
            text: 'Predicted world population (millions) in 2050'
         }
      }
   });
});
So what are we doing here:
- Use jQuery to wait until the document page has been loaded.
- Get a reference to the object with the myChart id.
- Call the Chart.js new Chart function:
- We pass the reference to myChart.
- We set the visualisation type to be a doughnut.
Please check out the full documentation for Chart.js doughnuts here: http://www.chartjs.org/docs/latest/charts/doughnut.html
Now we will test our Extension, and as we have not included any Tableau specific code as yet, I will do the following:
- In the Visual Studio Code Terminal type
http-serverto start a local server. - Open up a web browser and go to
localhost:8080- or on whichever port http-server decides to open on, you should see this in the Terminal.
If you see a pretty sweet doughnut chart opening up before your eyes, Congratulations, you have created a web page that shows a Chart.js chart, but now open the .trex file within Tableau and see if you can now see the Doughnut Chart within Tableau Desktop.
Note: I am a big fan of code reuse and the Chart.js code came from the application.js code came from http://tobiasahlin.com/blog/chartjs-charts-to-get-you-started; why not check out the other examples?
Ok, now that we have a project and connected files, a manifest file and a working extension that can be opened within Tableau Desktop, we are now going back to the raison d’etre of this article, getting data from Tableau.
Getting Data
Now that we have everything set up and working, we are going to change as little as possible, actually, the only file we are going to change is the application.js; but before that, we need to set some expectations. Providing a sleek configuration box that will allow extension users to change settings will be the topic of the next article, in this article, we are solely going to test data connectivity i.e. we are going to hardcode the name of worksheets, and column numbers.
Let us start by building this worksheet so that we all are singing from the same hymn sheet:
- Open Tableau Desktop.
- Create a new Worksheet called worksheetData.
- Open the Superstore sample data source.
- Drag Region onto Columns, and Sales onto Rows.
This is quite a simple worksheet.
Now we will change our application.js code to the following:
'use strict';

(function () {
   $(document).ready(function () {
      // Initialises Tableau Data Extension
      tableau.extensions.initializeAsync().then(function () {
      // Once we initialize we call teh drawChartJS function.
      drawChartJS();
   }, function () { console.log('Error while Initializing: ' + err.toString()); });
   });

   // This javascript function gets data from our worksheet and draws the Doughnut.
   function drawChartJS() {
      // Gets all the worksheets in a Tableau Dashboard
      const worksheets = tableau.extensions.dashboardContent.dashboard.worksheets;
      // Finds a worksheet called worksheetData
      var worksheet = worksheets.find(function (sheet) {
         return sheet.name === "worksheetData";
      });

      // Call a function on the worksheet Object to get the Summary Data.
      worksheet.getSummaryDataAsync().then(function (sumdata) {
         // Create an empty arrays for our labels and data set.
         var labels = [];
         var data = [];

         // We get our summary data:
         var worksheetData = sumdata.data;
         // We loop through our summary data and hardcode which columns goes into Label
         // and which column goes into the array.
         for (var i = 0; i < worksheetData.length; i++) {
            labels.push(worksheetData[i][0].formattedValue);
            data.push(worksheetData[i][1].value);
         }

         // Draw the chart as before.
         var ctx = $("#myChart");
         var myChart = new Chart(ctx, {
            type: 'doughnut',
            data: {
               labels: labels, // This now comes from Tableau
               datasets: [{
                  backgroundColor: ["#3e95cd", "#8e5ea2", "#3cba9f", "#e8c3b9", "#c45850"],
                  data: data // This now comes from Tableau
               }]
            }
         });
      });
   }
})();
Now let us add this extension worksheetData to our Tableau Dashboard (add as a float and make small, as in to hide it), then let us add our Extension and see the results. If all goes well, you should see something along the lines of:
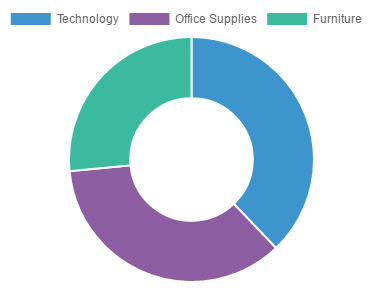
Boom, click on the legend to add or remove data from the visualisation, boom, now, remember that we are hard coding values, but we have connected Tableau data to Chart.js. Now have some individual fun, check out the other available examples on Chart.js, or how about D3.js or other cool technologies. Check out the Tableau Extensions API Reference to see what is available for you to call: https://tableau.github.io/extensions-api/docs/index.html
You can the code on my GitHub repository here: https://github.com/simplifyinsights/tableau-extensions-tutorial-part-two
Summary
Ok, so that is the end of the second part of this tutorial and we are slowly building up to our big Extension; in this tutorial we covered:
- Setting up a project (repetition is a great teacher).
- Getting a third-party visualization library (in Chart.js).
- Retrieving Summary Data from a Tableau Workbook.
- Wiring the Tableau Data to Chart.js.
I hope you enjoyed this tutorial and look forward to the other parts of this series where we will go through the following:
- Tableau Data Extension Part 1 – Getting Started
- Tableau Data Extension Part 2 – Accessing Underlying Data
- Tableau Data Extension Part 3 – Adding Extension Configurations
- Tableau Data Extension Part 4 – Adding Event Listeners
As always, let me know what you thought about the tutorial by leaving a comment below, or reaching out to me on Twitter on @Tableau_Magic.
If you like our work, do consider supporting us on Patreon, and for supporting us, we will give you early access to tutorials, exclusive videos, as well as access to current and future courses on Udemy:
- Patreon: https://www.patreon.com/tableaumagic
Also, do be sure to check out our various courses:
- Creating Bespoke Data Visualizations (Udemy)
- Introduction to Tableau (Online Instructor-Led)
- Advanced Calculations (Online Instructor-Led)
- Creating Bespoke Data Visualizations (Online Instructor-Led)


I have been following all your posts in Tableau Magic and these are extremely great, thank you for that.
Have one requirement with extension for providing drop down option for user to choose data source,table and required fields out of from the selected table and then once user hit the download button then it has to download data for the selected fields. Download format could be either xls or csv, I wanted to create my own trex file instead of using third party provided trex files.
Please provide example for me to do it.
Hi Ganesh, you don’t just need a trex, but you need to build an extension that takes the data from a worksheet (you have to access a data source through a worksheet), and then to generate and output the data format. Basically, you will need to build an end to end extension to enable this functionality.
Hi Toan,
Thank you so much for the Tutorial. I have followed your Tutorial 1 with no issues. Tutorial 2 chart works with static data. But does not show chart (just blank) after update the application.js to use the worksheetData. I am using Tableau v2020.2 in Windows 10. Is there a compatibility with this version? Note the worksheet shows the sample data but the extension shows blank.
Any help is appreciated
I found errors below in Terminal. What does it mean?
[2020-08-11T23:28:18.278Z] “GET /js/tableau-extensions-1.0.0.min.js” “Tableau Desktop 20202.20.0525.1210; pro; libcurl-client; 64-bit; en_US; Microsoft Windows 10 Enterprise (Build 17134); Mozilla/5.0 (Windows NT 10.0; Win64; x64) AppleWebKit/537.36 (KHTML, like Gecko) QtWebEngine/5.10.0 Chrome/61.0.3163.140 Safari/537.36”
[2020-08-11T23:28:18.280Z] “GET /js/tableau-extensions-1.0.0.min.js” Error (404): “Not found”
[2020-08-11T23:28:18.280Z] “GET /js/tableau-extensions-1.0.0.min.js” Error (404): “Not found”
This means that your Tableau extensions library is not in the js directory. Can you make sure that it is there?
Thank you for the quick reply. It turns out I miss typed the “worksheetData” name. The above errors were not related (due to I tried to use the latest version of extension). All is good now.
Fantastic 🙂
BTW, where does “Console.log” output go? I would like to use it to trace my code.
You can find the information in Chrome if you are debugging.