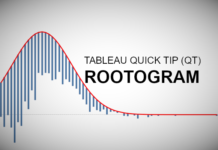
Tableau QT: Rootogram
Last week our Tableau Quick Tip was on creating a Histogram with a Normal Distribution Curve. This week we are going to build a variation of this and our Rootogram (hanging...
Supporting Tableau Magic Through Patreon
For those who have never heard of Patreon, Patreon is a platform that helps to bridge the gap between Content Creators and appreciative supporters. Towards the end of 2019, Adam Mico...
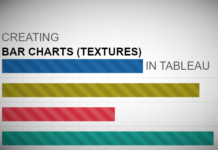
Create a Bar Chart (Textured) in Tableau
Requested by a student, here is a tutorial on adding Textures to Bar Charts to create a very nice and interesting effect. This uses data densification as well as images in...
Tableau Magic / Education and Social Engagement 2019
Tableau Magic was born from a desire to help you. You, who may be a novice on a journey into data analytics, or perhaps, you, who may be a well-seasoned veteran...
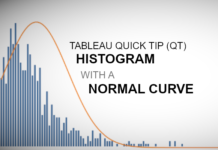
Tableau QT: Histogram with Normal Curve
Welcome to 2020. Hopefully, this will be the start of a glorious year, and we at Tableau Magic are definitely excited for things to come. Here is our first Tableau Quick...
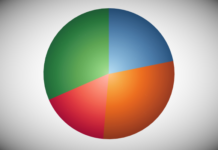
Creating a Gradient Pie in Tableau
Welcome back everyone. This is going to be a very exciting 2020 for Tableau Magic, and we truly hope you come along with us for the ride. To start off with,...
Tableau Twelve-Step Programme for 2020
With every new year comes new challenges, new opportunities and, more importantly, a chance of exploring new directions. Here is my twelve-step programme to kick-starting your Tableau journey 2020.
1. Download and...
Tableau QT: OHLC Charts
In this Tableau Quick Tip, we are going to create an Open-High-Low-Close (OHLC) chart in Tableau, we will do this within 5 mins or less.
Data
Let us start by loading the following...
Shaped Bar Charts (3D) in Tableau
We previously had an article about creating Shaped Bar Charts in Tableau; in that previous tutorial, we used data densification to create a different look and feel for our bar charts....
Creating a Marimekko Chart in Tableau
To close off there year, he is a quick and simple tutorial on creating a Marimekko Chart in Tableau. No data densification or any such data tricks. Just a few Table...


