Tableau QT: Custom Shapes
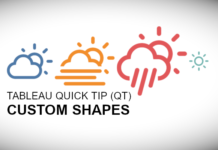
Custom Shapes allows you to add an extra dimension to your visualisation and have the benefit of being very easy to do. As such, in this quick tip, we are going...
Arrow Doughnut Chart
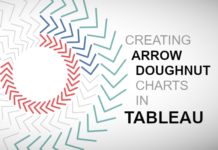
I saw the following data visualisation and thought that I had to create it, but once I created this I had no idea what I would call it. Baseball Stitches, Chevron...
S1E10 / A Conversation with Merlijn Buit
Tableau Zen MasterFounder AppsforTableauInnovative Partner of the Year 2019
Twitter: @MerlijnBuitWebsite: https://appsfortableau.com/Tableau Public: https://public.tableau.com/profile/merlijn.buit#!
Merlijn loves technology and, as a child, he was always watching his father repairing televisions, radios and other items...
Cylinder Charts in Tableau
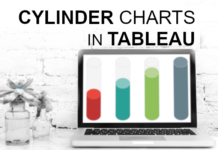
I was going through Google looking for data visualisation inspiration and came across a thread in the Tableau Forum which talks about creating a Cylinder Chart, and more interesting, if it...
Tableau Magic / A Year of Magic
This has been a wonderful first year for Tableau Magic. From pushing my limits in creative visualisations, to engaging with members of the community, to providing a platform for helping people...
S1E9 / A Conversation with Sarah Burnett
Tableau viz & data geek, made in #NZ, living in #SG!Trying hard to mix it up in the world of banking!Co-Leader #SGTUG and #TableauAmbassador #TC17 #TC18
Twitter: @sezbeeLinkedIn : https://www.linkedin.com/in/sezbeeWebsite: https://sezbee.comTableau Public: https://public.tableau.com/profile/sarah.burnett#!
Sarah is a kiwi
living...
Waffle Charts in Tableau
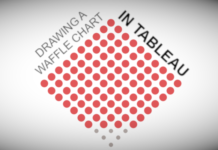
This is one of the most requested tutorials, so I thought why not write it for a little fun. Yes, it a fun Waffle Chart. Now, I could use a scaffold...
S1E8 / A Conversation with Ken Flerlage
Tableau Zen Master. Analytics Strategist & Architect. Assistant Director, BI at Bucknell
Twitter: @flerlagekrWebsite: https://www.kenflerlage.com
A year ago, Ken would have told you that he has an identical twin brother, but now that...
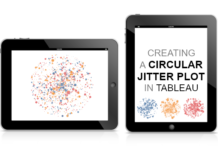
Circular Jitter Plots in Tableau
Yes, I have been experimenting with Jitter Plots recently, and created the following Circular Jitter Plot in Tableau; this type of chart does create a distinct and unique look, so I...
S1E7 / A Conversation with Emily Kund
Data+Leadership=Happiness. I also like fitness & family.Founder of @thefringefest @prettystrngsmart & Analytics to Inform.Tableau Ambassador.
Twitter: @emilykundWebsite: https://www.analytics2inform.com/
Emily gladly stepped back from her 19-year career to be more present with her kids....


