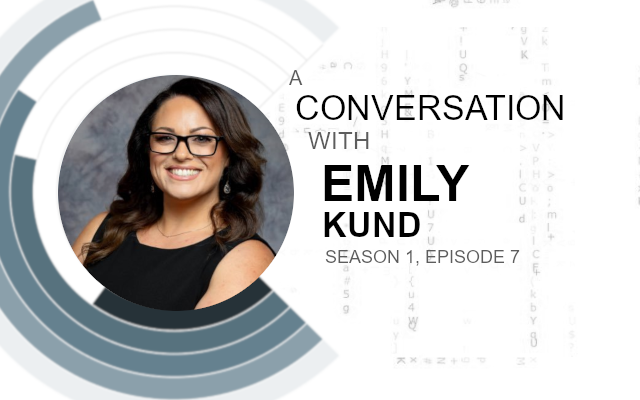
Data+Leadership=Happiness. I also like fitness & family.
Founder of @thefringefest @prettystrngsmart & Analytics to Inform.
Tableau Ambassador.
Twitter: @emilykund
Website: https://www.analytics2inform.com/
Emily gladly stepped back from her 19-year career to be more present with her kids. She loves working out and most nights of the week, you can find her either in the
I had the pleasure of having a conversation with Emily about her journey in Data.
Toan: Tell us a little about your background, how did you get into Data Visualisation and Tableau?
Emily: I was introduced to Tableau through some training I had at work. Though I was busy being the business system admin for a data retrieval system, I saw how powerful it could be. A couple of years later, when I became a Reporting and Analytics Team Lead, I had the opportunity to help increase adoption of Tableau and data visualization. I went to my first Tableau Conference in 2011, but 2013 was when I felt that spark and decided to get involved in the Tableau community. My involvement helped me learn the tool and help guide my team’s development. And since then, there was no looking back. I see the potential to help people to gain insights from data almost everywhere!
Toan: What gave you this spark and drove you to get involved in the Tableau community?
Emily: It was the people. I started building relationships and when I was around other people that got excited about charts, it made me excited too. It started with my blog and from there, things evolved naturally —the podcast and the fringe festival, just came to be.
Toan: Tableau projects come in various shapes and sizes, personally speaking, what has been the most rewarding work (or project) you have done in the Tableau space, and why?
Emily: I think my most favorite project was my Multiple Sclerosis visualization from years ago. It was personal as my mom had MS (she’s in remission now). My main objective though was to raise awareness about the disease; it’s very individualized and very difficult to diagnose. I used this viz to help raise funds for the MS Walk.
Toan: It is great to hear your mother is now in remission, I pray it stays that way. What role do you think data visualisations can play in raising awareness of different causes?
Emily: As with any subject, we can show the message, the insight, or the story that the data is trying to tell us in a more engaging way than just a table of numbers or narrative. As a result, people are more likely to stop scrolling and look at it. And when done effectively, people can learn about subjects they hadn’t even heard of before. Whether it’s an MS viz, saving the trees, or birds, we should be able to synthesize the information quicker and when a viz is crafted with heart, it will resonate with people.
Toan: How can others get involved in such data initiatives? What are your thoughts about it?
Emily: If you’re moved to do so, I would say find something that you care about and start there. Or find a project (such as Viz for Social Good, Data for a Cause, or Project Health Viz, to name a few). There may also be opportunities to work with the Tableau Foundation, which is also doing amazing work!
Toan: To add to the above, what was the most challenging project you have experienced in Tableau, and why? How did you overcome this challenge, and what advice would you give to people who experience the same challenge? What would you say to yourself if you had a time machine?
Emily: My most challenging project in Tableau was in a prior job, where my first ever Tableau project was for executives. They wanted everything in one dashboard, the data had never been joined together in how we used it, I didn’t have the advanced technical skills (what they wanted was not something most people knew how to do), even though I contributed to the data and understood it conceptually, I struggled to communicate the data displayed in the workbook, and looking back, I think the worst part is that I didn’t have a posture of authority/confidence. It was a knock on my career, and I was distraught. The thing that changed was the program manager. The new PM was more directive and had the posture of authority so that I could be the resource. It really was the start of a transformation for that organization; using data outside of the system it was built for. It was definitely a character-building exercise and it led me to really key in on educating people whenever I had the opportunity. My advice for people in a similar situation would be to have the best posture possible and to know the data inside and out and how it has been manipulated in Tableau. If I had a time machine, I would go back and make sure I understood the calculations and the way the data changed. Being visual, I would flow chart it so I could connect the dots to what I knew about how the data went from input to dashboard.
Toan: Do you think that we in the Tableau community pay too much attention to data visualisation, and not enough attention to the data stack?
Emily: To be honest, I don’t know! I think so much is dependent on the data environment people work in. My guess is that good analysts see potential opportunities (or pitfalls) and will help provide solutions, to the extent possible.
Toan: What do you think are the best steps for someone to start their path into learning about data? A lot of people have asked me about this, but there are so many places you can start, what would you recommend?
Emily: This is still a journey I am on, considering I have been a source and a user, but never in data management. I think it also depends on who is doing the learning. I deal with people who cringe at the word ‘data’, so I tend to use concepts from mathsisfun.com: https://www.mathsisfun.com/data/data.html
Toan: Tableau is amazing, where do you see Tableau going in the next few years. What features would you love to see, or functionality improved upon? If you were the CEO of Tableau, what would you see as key?
Emily: This is always a fun question. I think the direction Tableau is going is a good one. I have always been in
If I were CEO, there would be several initiatives I would look to implement.
- Make the tool even more intuitive. I would love to see Tableau make the calculation process easier to understand. At
one-point , former CEO Christian Chabot said that he wanted Tableau to be as commonplace as Microsoft Excel (I paraphrased the comment). The beautiful thing about Excel (or any spreadsheet program) is that you can see what is happening. Having to learn how Tableau works under the hood is exhausting to figure out how to show that 2+2=4. Is the juice worth the squeeze? Yes, for people who develop reports and analytics day in and day out. For the rest of the people who want to take advantage of the beautiful visualizations and capabilities of Tableau, I think there’s room for progress there. I don’t have the answer to what that looks like though and I understand the challenge of making a tool to fit advanced and basic users. Ideally, I would be able to customize my default interface with basic or advanced (as well as defaultcolor and font choices). Chang e the subscription model. I get that so many companies are doing this and it’s a great way to make it affordable in the short-term as well as provide sustainable recurring income. However, I think the subscription minimums are a challenge and I would look to reduce or eliminate those. For example, the subscription minimums for explorer licenses are $35/month with five licenses minimum. What if you’re a small business who wants the power of Tableau and need two or three licenses? The explorer (or viewer) licenses become more expensive than the creator license if you need just a few people to view or interact with the work created. To me, this is frustrating, so I would change the pricing model so that it works for the company and the clients.- As CEO, I would have better diversity in the C-Suite. I love that the staff and middle management level is full of diversity, but what I would really love to see is an opportunity to promote from that diverse workforce to groom senior executives. While decisions made at that level are more informed because of diversity, what about the decisions at the C-Suite? There is some diversity, but not a great deal. This isn’t a knock on the people in the C-Suite currently, I think the world of them. But for me, I place a greater value on having a diverse C-Suite and Board. If only looking at gender diversity, there is one woman in the C-Suite (one of nine or 11%) and two women (
of ten people or 20%) on the Board. Additionally, according to best practices, an odd number of Board members is a better approach, so I would add one member (because ten could lead to ties, depending on how thegovernance documents are written). Since we see the diversity in the staff and middle management level, it would be AMAZING if we could see those individuals rise up through the ranks to take on the C-level positions when they are open (sales and marketing are the two most recent ones where I saw an opportunity). - Continue to nurture the Tableau community. I have told people that the community is what makes the difference for this tool. Had it not been for the Tableau community and my engagement in it, it really would have just been another work tool.
- Ensure the culture the company was founded on is not forgotten. Tableau has grown tremendously in the eight years since my first conference. The company will go through growing pains but making sure the thing that got the company to the top of the MQ, continues to be part of what keeps the company at the top.
Toan: Do you see Tableau growing to be as big as Excel? Installed on every machine? What do you think are the barriers now to achieving this? Data literacy is a movement on the rise, how can we all play our part?
Emily: It would be cool to be proven wrong, but I don’t think Tableau will be as common as Excel. There are several reasons for that. To start, they serve two different needs, have been in the market for different periods, and the price points are extremely different. In terms of Tableau’s prevalence relative to other BI tools, I would say it is there.
Toan: What more can Tableau do to nurture the community? What more can everyone do to help the community grow? How long until someone should start contributing?
Emily: This is a tough one. I have a hard time seeing where that line is for what Tableau should do. I think it is amazing that we have access to Tableau employees who help support the community. I saw a reply from Amanda Boyle over the weekend on Twitter to a community member. I think, dang, they deserve time away from work too. What more can they do? I don’t know if there’s anything more they can do because I think the components are there.
I have also been reflecting on this ‘growing the community’ idea for a while. I wonder now if there should be more growth. Let us liken it to Excel for a minute. There are some amazing resources out there on Excel tips and tricks, but do we really expect or encourage every user of Excel (or Google Sheets for that matter) to be a contributing member of that respective community? No. So then why would we have that same expectation for Tableau when we think of ‘The Community’.
Do not misunderstand, I think we should support people and encourage them to contribute or participate in their own way. But I do not think growth for growth’s sake is a great goal. I will fully admit being a hippie in this regard. I would rather let people find their spark and be supportive of them. If people feel called to contribute or participate (even if they are scared), there is support. To be truthful, it is hard now to keep up with everyone doing all the things (all the blogs!) and I miss a lot of what has been going on. For example, when Mark Jewett tweets a thought of the day to the Tableau community about being a keyboard warrior, then something is off. So, is this a time to push growth or to stabilize? And because these interactions are public, other people outside of Tableau see this too. For example, after I gave a talk about the benefits of getting involved in the Tableau community, Jon Schwabish asked me about some of the (negative) commentary online. These are little indictors to me that growth shouldn’t be the focus. It is more like the old adage, quality over quantity. To put a bow on this particular question, I do not have the answer. What I do know is how I show up. I love doing the Tableau Wannabe Podcast and I am proud of the platform that we have built with the Tableau Fringe Festival. I am happy to serve the community in that way.
So as long as people (new and old) show up the way that brings them joy, then I say, welcome.
Toan: Tableau has an amazing community for learning and there are loads of places to go. What is your top tip for really excelling within Tableau, what is your secret?
Emily: First, find your people who you can be vulnerable with. You do not have to share your deepest darkest secrets, but at the same time, find people who you are comfortable sharing ‘I do not know how to do __.’
Second, practice. There are so many projects and resources out there. One thing that I wish I had done was to be consistent with my practice. Because Tableau was not part of my job until recently, I could not spend the time I needed to with it. As a result, I was like,
Third, follow blogs and people, whether it is on twitter or the community forums. For the most part, the two that tend to pop up for me from a technical skills perspective tend to be Ryan Sleeper and Andy Kriebel. I also greatly value the work and perspective that Fi Gordon, Paul Chapman, Paul Banoub, Alex Waleczek, Nelson Davis, and Sarah Bartlett have. I also think folks like Matt Francis and Matt Chambers are worth tapping into. While they might be quiet from time to time, they are building out Tableau training that is really impactful. There are a ton of others as well, but these are a few that are top of mind.
Fourth, contribute and engage. Put your thoughts and work out there. Have productive conversations about it. Learn and help others.
Toan: How did things change once Tableau became a part of your job? Has it changed anything? If so, how have things changed?
Emily: One of the side effects of my last job was the stress it had on me. I wasn’t my creative self and that took a toll on playing with Tableau…I just didn’t have the brain space. So, for me, I’m happy to have that creativity rekindled. Because I freelance now, it is just my tool of choice and I see an immense value in helping me serve the people I want to serve.
Toan: For those that are thinking about transitioning into a career using Tableau, what has it been like for you? Was it as expected? Do you have any regrets or things you would have done differently?
Emily: I think my biggest advice is to consistently practice and build that portfolio. That is also my regret, that I didn’t do.
Last year, Emily gave a $500 scholarship to a graduating senior but that is a drop in the bucket. she really wanted to pay for college tuition for multiple girls and provide parent resources, and continue to do the school outreach, but that takes money to do all of that. In her words “I’m also pretty simple. I just want to make a difference, live a fulfilled life, see my kids be happy, and to be happy myself.”
Data+Leadership=Happiness. I also like fitness & family.
Founder of @thefringefest @prettystrngsmart & Analytics to Inform.
Tableau Ambassador.
Twitter: @emilykund
Website: https://www.analytics2inform.com/
A Conversation with Season 1:
- Episode 1 / Mark Bradbourne
- Episode 2 / Josh Tapley
- Episode 3 / Lindsay Betzendahl
- Episode 4 / David Pires
- Episode 5 / Dilyana Bossenz
- Episode 6 / Yukari Nagata
- Episode 7 / Emily Kund
- Episode 8 / Ken Flerlage
- Episode 9 / Sarah Burnett
- Episode 10 / Merlijn Buit


