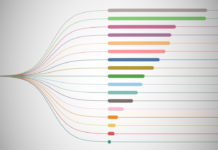
Single Level Sankey Diagram
I saw this data visualisation while being a judge for #IronViz and thought that I should add this to my library of cool and interesting data visualisations. I hope you enjoy...
Video: Tableau with Music / Dendrogram with Rounded Bar Charts
Using a few neat tricks and some Table Calculations, we have created this awesome chart in Tableau. Enjoy.https://youtu.be/ywH3qFD9UNIWritten TutorialYouTube Channel
Creating Curved Polar Chart in Tableau
Just for a little bit of fun before I take a month off blogging, yep, we all need a little break fro time to time, I decided to have some fun...
Video: Tableau with Music / Single Level Dendrogram
Using a few neat tricks and some Table Calculations, we have created this awesome chart in Tableau. Enjoy.https://youtu.be/AYeb8rb_FZAWritten TutorialYouTube Channel
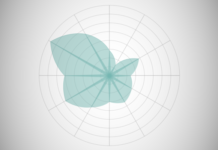
Creating a Polar Chart in Tableau
As we close down our second set of tutorials in 2020, I wanted to finally have some fun with Polar Charts, so here you have it, something that is often asked...
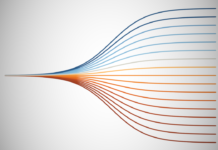
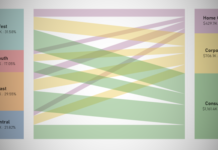
Creating Parallel Sets in Tableau
I want to end my second wave of Tableau Tutorials with something a little special. I have to admit that to create the following data visualisation, I had to make several...
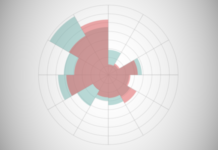
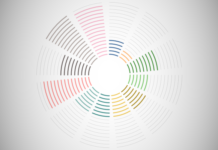
Create a Radial Column Chart (Variation)
I wanted to have some fun and build up a Polar Chart, however, I had an accident and decided to run with it, and this is the resulting data visualisation. I...
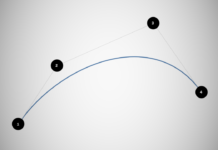
Creating a Bezier Curve in Tableau
I love experimenting with Tableau and I wanted to revisit my formal education and explore how we might be able to draw a Bezier Curve in Tableau. Although I have no...
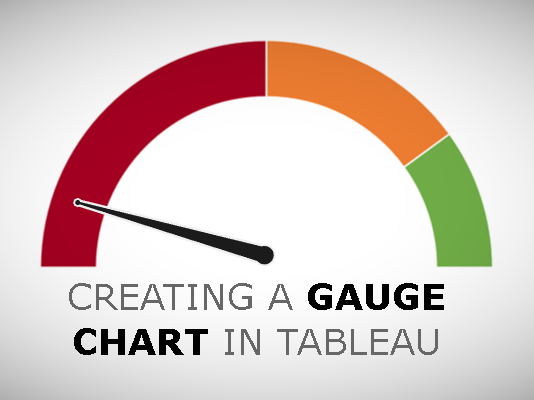
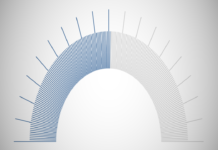
Video: Tableau with Music / Gauge Chart
Using Parameters, Bins and quite a few Table Calculations, we have created this awesome Gauge in Tableau. Enjoy.https://youtu.be/v75ERzagsXcWritten TutorialYouTube Channel
Creating Tilted Bar Charts in Tableau
I saw this data visualisation by Alex Jones on Data Visualisation Trump's Executive Time and the visual effect stuck with me. So, I eventually got around to writing this tutorial on...


