Creating a Multi-Level Dendrogram Charts in Tableau
Since I released my Dendrogram tutorial I have been inundated with requests on how to a multi-level version. So, in this tutorial, we are going to leverage some interesting techniques to...
Creating Parallel Sets in Tableau
I want to end my second wave of Tableau Tutorials with something a little special. I have to admit that to create the following data visualisation, I had to make several...
Creating a Polar Chart in Tableau
As we close down our second set of tutorials in 2020, I wanted to finally have some fun with Polar Charts, so here you have it, something that is often asked...
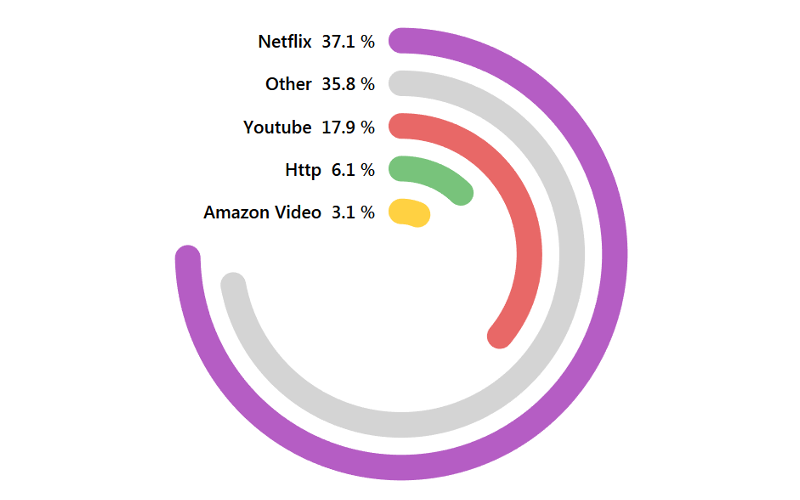
Creating Circular KPIs in Tableau
After the Barcelona vs Bayern Munich Semi-Finals for the Champions League 2020, I was browsing Twitter to see reactions and saw a circular KPI visualisation and thought that I would create...
Creating Dendrogram with Rounded Bar Charts in Tableau
I am really having a fun moment with Dendrogram Charts, and in this tutorial, we are going to combine a Dendrogram Chart with Rounded Bar Charts to create a very nice...
Single Level Sankey Diagram
I saw this data visualisation while being a judge for #IronViz and thought that I should add this to my library of cool and interesting data visualisations. I hope you enjoy...
Shaped Bar Charts (3D) in Tableau
We previously had an article about creating Shaped Bar Charts in Tableau; in that previous tutorial, we used data densification to create a different look and feel for our bar charts....
Sigmoid Area Charts in Tableau
I was working on an update to our Curved Line Charts and thought about turning this onto a Curved Area Chart, or Sigmoid Area Chart. I am going to be exploring...
Creating Path Charts in Tableau
This is a tutorial that I have been wanting to write for over a year, however, the mathematics behind this really eluded me. Then one lazy Sunday, I decided to have...
Creating Bar with Trend Chart in Tableau
Sometimes, I will get an idea stuck in my head, an image, a type of data visualisation, and I will obsess about it until I have figured out how to create...


