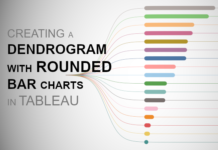
Creating Dendrogram with Rounded Bar Charts in Tableau
I am really having a fun moment with Dendrogram Charts, and in this tutorial, we are going to combine a Dendrogram Chart with Rounded Bar Charts to create a very nice...
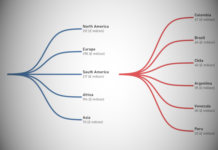
Creating a Multi-Level Dendrogram Charts in Tableau
Since I released my Dendrogram tutorial I have been inundated with requests on how to a multi-level version. So, in this tutorial, we are going to leverage some interesting techniques to...
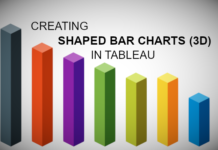
Shaped Bar Charts (3D) in Tableau
We previously had an article about creating Shaped Bar Charts in Tableau; in that previous tutorial, we used data densification to create a different look and feel for our bar charts....
Creating Gradient Backgrounds in Tableau
When I created my Cryptocurrency Dashboard, I decided to have some fun with gradient backgrounds. When combined with animations, this creates a very cool effect, so here you go, a nice...
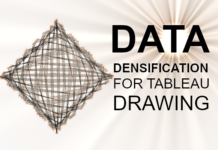
Data Densification for Tableau Drawing
If you have looked at the various tutorials on drawing in Tableau, you would have noticed a commonly used technique called Data Densification. While I used this topic, the vast majority...
Gauge Chart (With Arrow)
As of the time of this article, I am a two-time Tableau Zen Master, and, as such, I am afforded several different types of opportunities from Tableau. One such opportunity is...
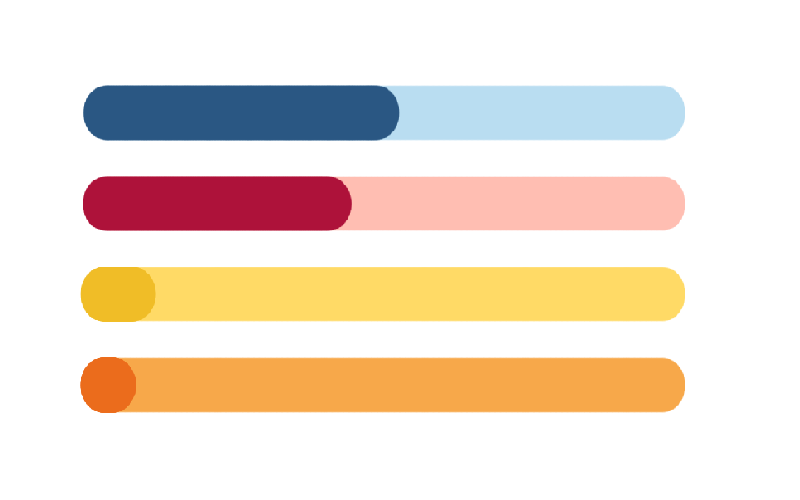
Rounded Progress Bar Tutorial
In my free time I try to build a few web applications, this is an essential part of my personal learning and attempt to keep relevant. Having an application that delivers great functionality is great, but...
Creating a Coxcomb Chart in Tableau
I had this one on my radar for so long now, literally, ever since I ventured in Bespoke Data Visualisations in Tableau. A student requested this tutorial, so I thought I...
Venn Diagrams in Tableau
I was challenged a few years back to draw an interactive Venn Diagram, not just have two transparent circles, which is not too difficult, but having two circles as well as...
Double, Spaced Doughnut Chart Tutorial
After the United Kingdom 2017 General Election, on Thursday 8th June 2017, I had many conservations about our First Past The Post system (FPTP), and why we do not have a Proportional...


