My Tableau Wishlist
I have been talking to several people about what I would like to see in Tableau over the coming years. This is a tough question, but as of today, I wanted...
Filled Circle Charts in Tableau
I created this tutorial a little while ago, but the math did not quite add up, so I had to remove the tutorial. After a little while decided to revisit this, and as such, here is my latest version of my Filled Circle Tableau data visualisation tutorial.
S1E6 / A Conversation with Yukari Nagata
Data Visualization Labs Path CEO & CVOTableau Zen MasterThe Head of JapanTUG
Twitter: @DataVizLabsPathWebsite: https://www.datavisualizationlabspath.com
Yukari Nagata, 永田ゆかり, Tokyo, joined the Zen Master class of 2019. Yukari is currently the head of the Japan...
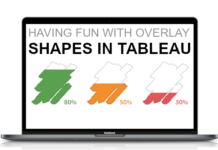
Having Fun with Overlay Shapes in Tableau
I am not the biggest fan of using floating shapes and, if possible, like to create all my data visualisations through drawing polygons. However, a lot of people on my Facebook...
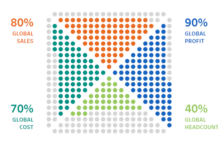
Dot Quadrant Chart in Tableau
I regularly look through websites for design, Pinterest, and other resources for ideas and regularly post to my Facebook Group. After posting one image, I received several messages about creating this...
S1E5 / A Conversation with Dilyana Bossenz
#Tableau Featured AuthorCo-leader of #BerlinTUG (Tableau User Group)#VizforSocialGood local chapter leader
Twitter: @DilyanaFlowerWebsite: https://vizpilgrim.blogspot.com
Dilyana was born in Tashkent, Uzbekistan and moved to Germany for 10 years. Dilyana wanted to have...
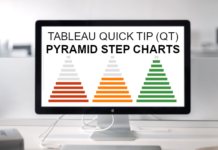
Tableau QT: Pyramid Step Chart
This is a Quick Tip on how to build a Pyramid Step Chart in Tableau, so less reading and more jumping in. We are going to spend 5 minutes or less...
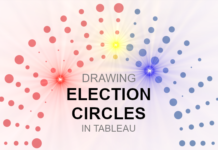
Drawing Election Circles
There have been a lot of requests to create this tutorial, especially with the upcoming elections, yep, I am starting to get excited about the election season. As such, here is...
S1E4 / A Conversation with David Pires
London Practice Lead for @interworks | Inaugural Iron Viz Europe Winner | Tableau Ambassador | London TUG Co-lead | Japanophile
Twitter: @davidmpiresWebsite: http://www.ivisualize.co.uk
David is a Portuguese in London since 2005 with a...
Tableau QT: Thermometer Chart
This is a Quick Tip on how to build a Thermometer Chart in Tableau, so less reading and more jumping in. We are going to spend 5 minutes or less building...


