


")


Tableau 2019.2 was released on Tuesday 21st May 2019 and comes with some very nice features. In this article, we are going to spend the next 10 minutes to look into the new MakePoint and MakeLine functions. I actually created a technique for creating an Arc Map in Tableau, and we are going to replicate this new awesome functionality.
Data
Load the following data into Tableau Desktop / Public.
From,From (Latitude),From (Longitude),To,To (Latitude),To (Longitude)
London,51.507351,-0.127758,Scotland,56.490669,-4.202646
London,51.507351,-0.127758,Wales,52.130661,-3.783712
London,51.507351,-0.127758,Spain,40.463669,-3.74922
London,51.507351,-0.127758,France,46.227638,2.213749
London,51.507351,-0.127758,Germany,51.165691,10.451526
London,51.507351,-0.127758,Belgium,50.503887,4.469936
London,51.507351,-0.127758,Netherlands,52.132633,5.291266
London,51.507351,-0.127758,Denmark,56.26392,9.501785
London,51.507351,-0.127758,Switzerland,46.818188,8.227512
London,51.507351,-0.127758,Italy,41.871941,12.56738
London,51.507351,-0.127758,Croatia,45.099998,15.2
London,51.507351,-0.127758,Slovenia,46.151241,14.995463
London,51.507351,-0.127758,Austria,47.516232,14.550072
London,51.507351,-0.127758,Czech Republic,49.817493,15.472962
London,51.507351,-0.127758,Poland,51.919437,19.145136
London,51.507351,-0.127758,Hungary,47.162495,19.503304
London,51.507351,-0.127758,Romania,45.943161,24.966761
London,51.507351,-0.127758,Greece,39.074207,21.824312
London,51.507351,-0.127758,Cyprus,35.126411,33.429859
London,51.507351,-0.127758,Turkey,38.963745,35.24332
London,51.507351,-0.127758,Finland,61.92411,25.748152
London,51.507351,-0.127758,Sweden,60.128162,18.643501
London,51.507351,-0.127758,Norway,60.472023,8.468946
London,51.507351,-0.127758,United States,37.09024,-95.712891
London,51.507351,-0.127758,Canada,56.130367,-106.346771
London,51.507351,-0.127758,Malaysia,4.210484,101.975769
London,51.507351,-0.127758,Singapore,1.352083,103.819839
London,51.507351,-0.127758,India,20.593683,78.962883
I am based in London and the following is a list of Countries that I have visited; I was actually surprised that the number is so low but I have been to multiple cities in each country. I am also adding South America and Africa to my to-do list.
Calculated Fields
We are going to start by creating the following Calculated Fields:
From Point
MAKEPOINT([From (Latitude)],[From (Longitude)])To Point
MAKEPOINT([To (Latitude)],[To (Longitude)])Note: The MAKEPOINT function takes in a Latitude and Longitude and create an object that represents a geographic point.
Path
MAKELINE([From Point], [To Point])Note: The MAKELINE function returns a line from two points.
MakePoint
We are now going to test our point Calculated Field; double-click on the To Point and you should see the following:
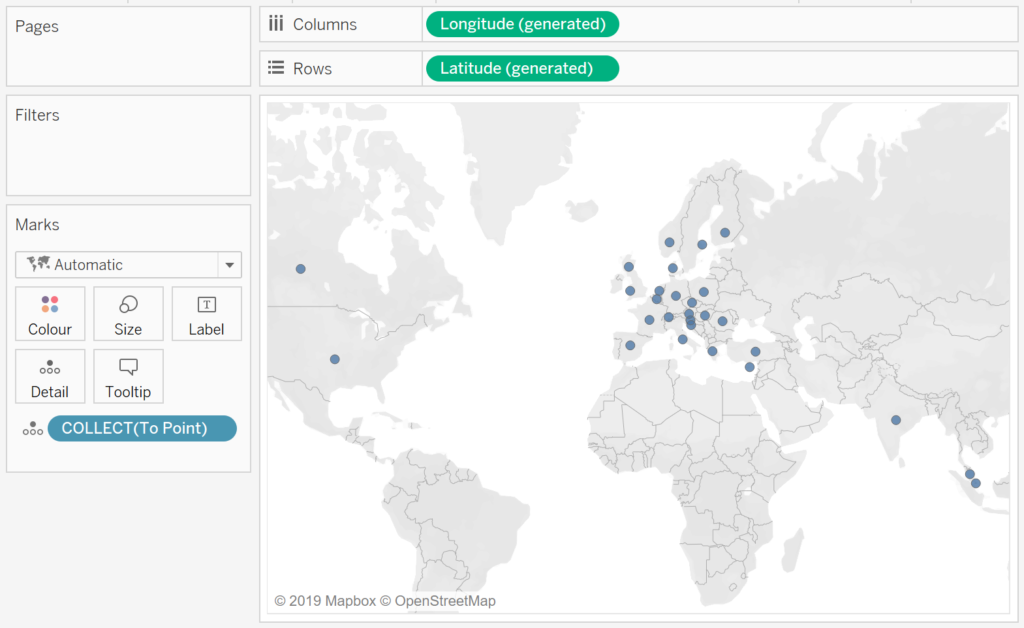
There are two points to note:
- Longitude (generated) and Latitude (generated) are added to the Columns and Rows.
- The COLLECT function is automatically added; the COLLECT function is an aggregate calculation that combines the values in the argument field; this argument must be a Geometry type.
If you have Longitude and Latitude in your data set, you can use the MAKEPOINT to convert this into a single combined object for usage in your data visualisations.
MakeLine
We are now going to update our data visualisation by dragging Line and dropping it on top of COLLECT(To Point) on the Details Mark, we want to replace this. You should now see the following:
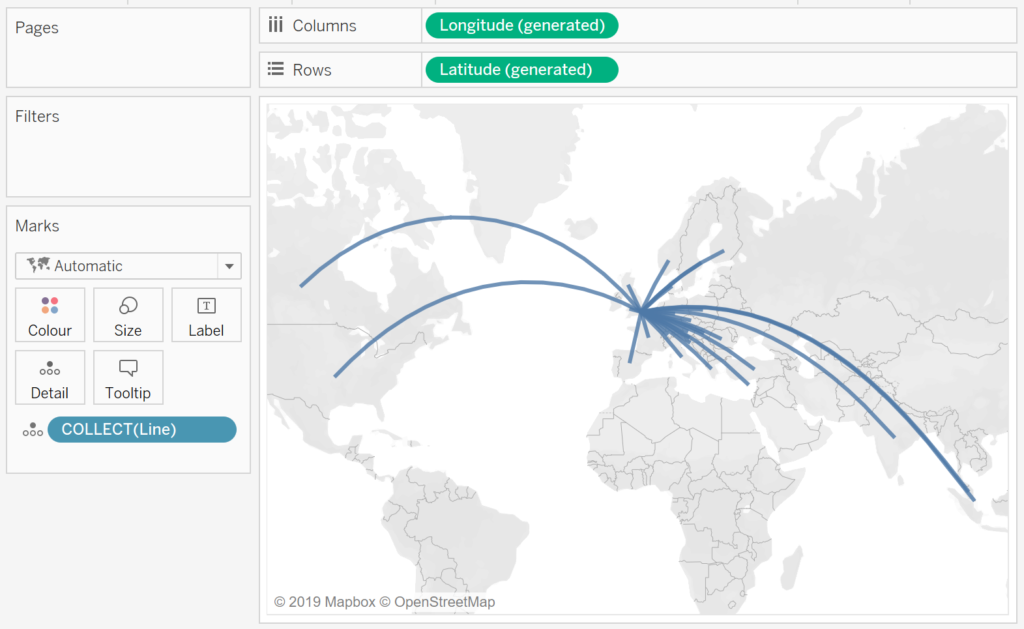
We now have a line connecting the To Point and From Point using the MAKELINE function, and we plotted this onto a data visualisation.
Combining
To finish off this quick feature review, we are going to have a little fun and combine the two versions above into a single data visualisation.
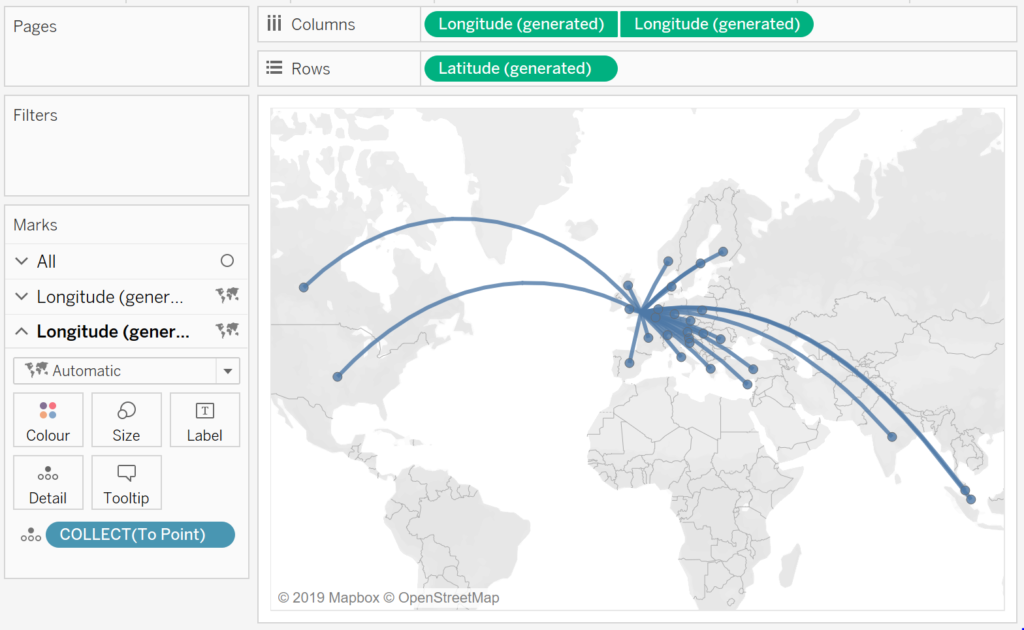
- Keep your finger of Ctrl (or Command for iOS) and drag Longitude (generated) to the right to create a copy.
- Click on the Longitude (generated) to show the Marks Panel.
- Drag To Point from the Data Pane and drop this on top of COLLECT(Line) to replace it.
- Right-click on the Longitude (generated) on the right and select Dual Axis.
You should now have the following:
and boom, we are done, I hope you had fun learning about this feature and you can read more about this on the Tableau Official Online help: https://onlinehelp.tableau.com/current/pro/desktop/en-gb/functions_functions_spatial.htm
Note: Tableau will be making improvements to the Spatial functions in 2019.3 and I cannot wait to see what they come up with.
Summary
I hope you all enjoyed this article as much as I enjoyed writing it. Do let me know if you experienced any issues recreating this Visualisation, and as always, please leave a comment below or reach out to me on Twitter @Tableau_Magic.


 in Tableau")


Toan the Magician, thanks a lot for yet another awesome chart.
I found your blog while searching for the updates, I am happy to be here. Very useful content and also easily understandable providing.. Believe me I did wrote an post about tutorials for beginners with reference of your blog.
Thank you for your message, it is always good to hear 🙂
Great visual Toan. I was wondering if there is any way to make a motion, trailing path? Like the one in this video:
Nothing is impossible, but it will require a little work. I have not given it too much thought to be honest.
Hi, great post. How would I go about making a map like this with multiple stops? So more than just a start and end point on the line?
Hi Briana, the MakeLine function only takes two arguments, so if you want multiple stops, you will need to add the lines into your data source.
Hi Toan, love your blog! Do you know if there is a way to create a radius filter to only show points within a set amount of miles using the MAKELINE and MAKEPOINT functions?
I think you might be looking for the new Distance Calculation. Check it out: https://tableau.toanhoang.com/tableau-2019-3-distance-function
hi Toan,
very nice Viz. Since MAKELINE accepts only to and from coordinates, is there a way to visualize a path with different stops? for example London to Australia via either Istambul, Dubai or any other middle point?
Thanks,
Joe
Hi Joe,
Yes, you would have to have a series of steps, each with their own start and endpoints. London to Australia, Australia to Brazil, Brazil to London for example.
Kind Regards,
Toan
hi Toan,
Thanks for that.
How would you then use the MAKELINE function? or is there any other function that accepts start, stop1, stop2,…, end?
Thanks
Hi Toan,
Thanks for the map.. This was very useful for my project and implemented it successfully.. There is one more requirement from my client here.. I have multiple source points and multiple destination points.. When I click on any source point, I’m able to show destination points with some icons, but i was not able to show any point on source.. if i keep source point, destination point goes away.. is there a way where i can show both source and destination points when i click on any source point.. Any help would be appreciated!!..
I am not sure that is possible, but you can try using highlight actions to get the effect you want.
Any idea how you could display To and From points? It doesn’t look like the Collect function works with both in the Mark.
Hi Toan;
Nice article. However I have another problem : I have data set with airports code (origin and destination) and I told Tableau that (designated the two columns as ‘geographic Role’). They could be displayed in the world map when I double-clicked on them. However when I try to use MAKELINE([origin], [destination]) to display the routes , Tableau told me that the two vars are stings. I think since Tableau could display their locations on the map it should have the latitude and longtitude as parameters stored in them. Anyway to use MAKELINE diectly with such airports ?
Hi Weyfun, I do not believe that you can use geographic in the Makeline function, you will need to have the Long and Lat in your data.
Hi Toan, Why my lines are showing straight not curved?