
Today, Python is one of the most sought after skills in the world of Data Science, and as such, we can leverage this power in our Tableau Data Visualisations. While integration is not entirely out of the box and requires some initial setup, it is not as hard to get up and running. In this article, we will introduce Python, show you how to integrate Python in Tableau, and more importantly, leave you with an example that you can build on.
Python Programming Language
Python is an interpreted, high-level, general-purpose programming language. Created by Guido van Rossum and first released in 1991, Python’s design philosophy emphasizes code readability with its notable use of significant whitespace. Its language constructs and object-oriented approach aim to help programmers write clear, logical code for small and large-scale projects.
Python gained a lot of traction in the world of data science and now has a host on fantastic libraries that support your requirements:
| Library | Description |
| NumPy | NumPy is a library for the Python programming language, adding support for large, multi-dimensional arrays and matrices, along with a large collection of high-level mathematical functions to operate on these arrays. |
| SciPy | SciPy is a free and open-source Python library used for scientific computing and technical computing. SciPy contains modules for optimization, linear algebra, integration, interpolation, special functions, FFT, signal and image processing, ODE solvers and other tasks common in science and engineering. |
| Pandas | Pandas is a software library written for the Python programming language for data manipulation and analysis. In particular, it offers data structures and operations for manipulating numerical tables and time series. It is free software released under the three-clause BSD license. The name is derived from the term “panel data”, an econometrics term for data sets that include observations over multiple time periods for the same individuals. |
| StatsModels | Statsmodels is a Python package that allows users to explore data, estimate statistical models, and perform statistical tests. An extensive list of descriptive statistics, statistical tests, plotting functions, and result statistics are available for different types of data and each estimator. It complements SciPy’s stats module. |
| Scikit-Learn | Scikit-learn (formerly scikits.learn) is a free software machine learning library for the Python programming language. It features various classification, regression and clustering algorithms including support vector machines, random forests, gradient boosting, k-means and DBSCAN, and is designed to interoperate with the Python numerical and scientific libraries NumPy and SciPy. |
| TensorFlow | TensorFlow is a free and open-source software library for dataflow and differentiable programming across a range of tasks. It is a symbolic math library, and is also used for machine learning applications such as neural networks. It is used for both research and production at Google. |
| NLTK | The Natural Language Toolkit, or more commonly NLTK, is a suite of libraries and programs for symbolic and statistical natural language processing (NLP) for English written in the Python programming language. It was developed by Steven Bird and Edward Loper in the Department of Computer and Information Science at the University of Pennsylvania. NLTK includes graphical demonstrations and sample data. It is accompanied by a book that explains the underlying concepts behind the language processing tasks supported by the toolkit, plus a cookbook. |
| Keras | Keras is an open-source neural-network library written in Python. It is capable of running on top of TensorFlow, Microsoft Cognitive Toolkit, Theano, or PlaidML. Designed to enable fast experimentation with deep neural networks, it focuses on being user-friendly, modular, and extensible. It was developed as part of the research effort of project ONEIROS (Open-ended Neuro-Electronic Intelligent Robot Operating System), and its primary author and maintainer is François Chollet, a Google engineer. Chollet also is the author of the XCeption deep neural network model. |
| Theano | Theano is a Python library and optimizing compiler for manipulating and evaluating mathematical expressions, especially matrix-valued ones. In Theano, computations are expressed using a NumPy-esque syntax and compiled to run efficiently on either CPU or GPU architectures. |
| Gensim | Gensim is an open-source library for unsupervised topic modeling and natural language processing, using modern statistical machine learning. Gensim is implemented in Python and Cython. Gensim is designed to handle large text collections using data streaming and incremental online algorithms, which differentiates it from most other machine learning software packages that target only in-memory processing. |
Note: this is a short list of popular libraries that can be leveraged in your Python code.
TabPy
TabPy (the Tableau Python Server) is an external service implementation which expands Tableau’s capabilities by allowing users to execute Python scripts and saved functions via Tableau’s table calculations. TabPy allows Tableau to remotely execute Python code.
It has two components:
- A process built on Tornado, which allows for the remote execution of Python code through a set of REST APIs. The code can either be immediately executed or persisted in the server process and exposed as a REST endpoint, to be called later.
- A tools library that enables the deployment of such endpoints, based on Python functions.
Tableau can connect to the TabPy server to execute Python code on the fly and display results in Tableau visualizations. Users can control data and parameters being sent to TabPy by interacting with their Tableau worksheets, dashboard or stories.
You can read more about TabPy in the official Github Repository: https://github.com/tableau/TabPy
Getting Started
Note: I will be showing you how to get up and running on Windows, however, the instructions should not be too different if you are an iOS user.
Notice: This section will be updated due to a new version of TabPy
Now that the introductions are out of the way, let us get started by installing Python, TabPy and to get everything integrated.
Download and Install Python
- Go to https://www.python.org and download Python 3.7.3.
- Once downloaded, double click and install Python.
- Now we will add Python to our Path.
- Click on the Windows Start button and type sysdm.cpl and click enter; this will open your System Properties.
- Click on the Advanced tab.
- Click on Environment Variables…
- Under System variables double click on Path; if Path does not exist, click on New…
- In Edit environment variable click on New and type the following: C:\Users\YourUserName\AppData\Local\Programs\Python\Python37-32
- Keep clicking Ok to close all the configuration windows.
- Now we will test that Python has been added to your machine.
- Click on the Windows start button.
- Type CMD and click enter to open up Command Prompt.
- Now type python –version (two hyphens).
- If you see Python 3.7.3, or whichever version you have installed, Python is working.
Download and Install TabPy
- Go to the following website https://github.com/tableau/TabPy/releases.
- Click on Source code (zip) to download the TabPy code.
- Once the file is downloaded, unzip the contents.
- Go to this directory and double click on startup.cmd.
If all goes well, you should see the following:

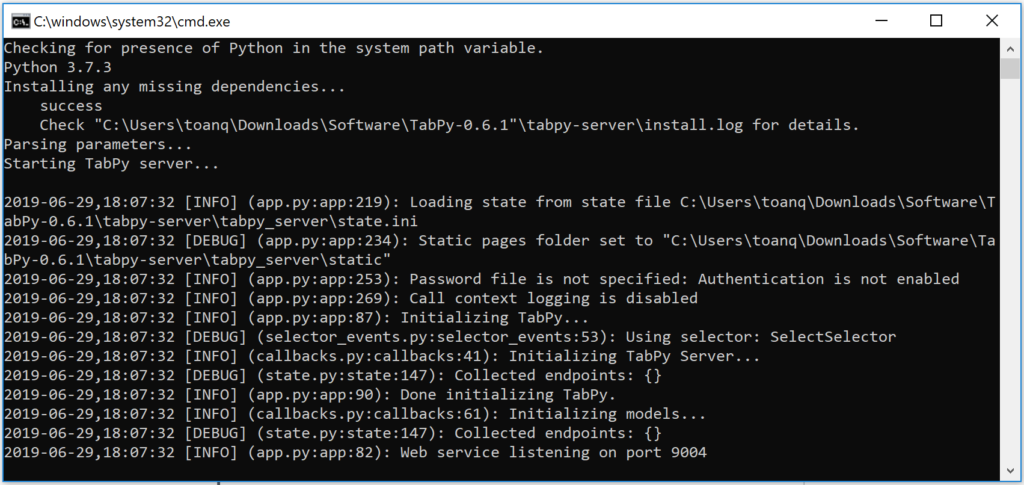
Note: if you get a Windows Security Alert, click on Allow access.
Tableau and TabPy
Now we will try to connect Tableau to the TabPy Server.
- Open Tableau Desktop.
- Go to Help in the application menu.
- Go to Settings and Performance and select Manage External Service Connection.
- In the External Service Connection dialogue window:
- In Select an External Service and select TabPy/External API.
- In Server type localhost.
- in Port type 9004, you can see the port that TabPy started on in the image above.
- Click Test Connection.
If all goes well, you should get a Successfully connected to the external service. and boom, we have installed Python, TabPy and connected to Tableau with TabPy, so are now ready to build a workbook and leverage the power of Python.
Worksheet
We are going to start by opening the Sample Superstore Data Source that is provided with Tableau Desktop. Using this Data Source, we are going to create a Calculated Field to perform Pearson’s Correlation Coefficient (r).
Correlation is a technique for investigating the relationship between two quantitative, continuous variables, for example, age and blood pressure. Pearson’s correlation coefficient (r) is a measure of the strength of the association between the two variables.
Let us create a Calculated Field called Pearson Correlation Coefficient:
SCRIPT_REAL("import numpy as np
return np.corrcoef(_arg1,_arg2)[0,1]",
SUM([Sales]),SUM([Profit]))
Things to note:
- We are importing the NumPy library.
- We are calling the corrcoef function and passing through SUM(Sales) and SUM(Profits).
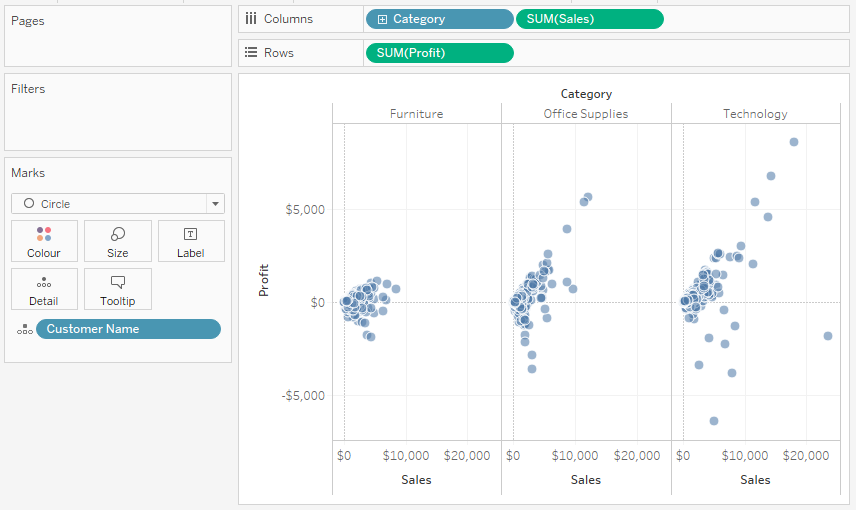
We will now build our worksheet:
- Change the Mark Type to Circle.
- Drag Category onto Columns.
- Drag Sales onto Columns.
- Drag Profit onto Rows.
- Drag Customer Name onto the Detail Mark.
You should now have the following:

Now we will use our Pearson Correlation Coefficient.
- Drag Pearson Correlation Coefficient onto the Colour Mark.
- You will see an invalid JSON error, but do not worry about that. Please close the dialogue.
- Right-click on this object, go to Compute Using and select Customer Name.
- Click on the Color Mark.
- Click on Edit Colour and select the Red-Green Diverging.
You should now end up with the following:

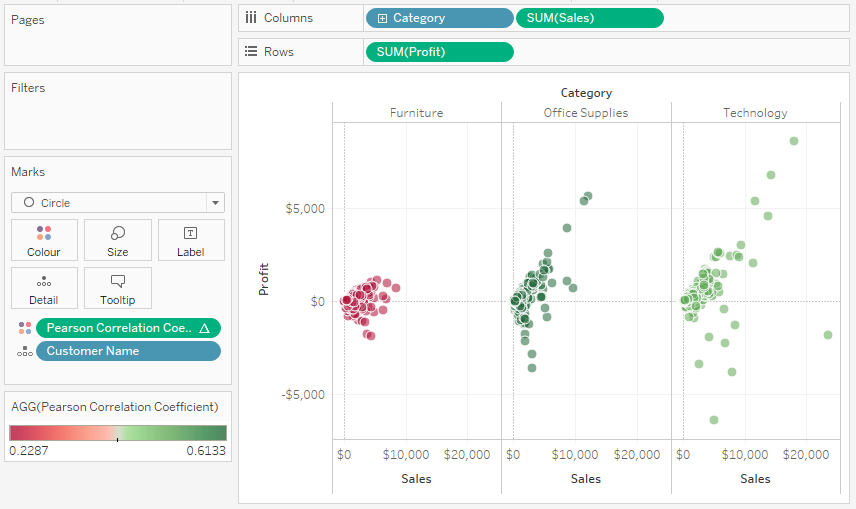
and boom, we are done. As it stands, we have installed Python, TabPy, Integrated Tableau and Python and created a Calculated Field that sends data to Python and returns a value that is rendered.
Summary
In future articles, I will expand on other possible uses of Python and the value that it can bring to your Tableau experience; I will cover topics like such as Sentiment Analysis, Identifying Outliers, and Data Science techniques to name a few.
I hope you all enjoyed this article as much as I enjoyed writing it. Do let me know if you experienced any issues integrating Tableau and Python, and as always, please leave a comment below or reach out to me on Twitter @Tableau_Magic, till next time, Have fun with Tableau.
If you like our work, do consider supporting us on Patreon, and for supporting us, we will give you early access to tutorials, exclusive videos, as well as access to current and future courses on Udemy:
- Patreon: https://www.patreon.com/tableaumagic
Also, do be sure to check out our various courses:
- Creating Bespoke Data Visualizations (Udemy)
- Introduction to Tableau (Online Instructor-Led)
- Advanced Calculations (Online Instructor-Led)
- Creating Bespoke Data Visualizations (Online Instructor-Led)