

One of the Tableau topics I am frequently asked is can we integrate Tableau with the R programming language for statistical computation? The answer is yes, Tableau can be integrated with R, but then the question becomes a discussion about the art of the possible and sometimes, inner chuckle, on how we can use ggplot2 output in Tableau dashboards.
In this article, I want to introduce R, RStudio, Rserve, and how we can pass information from Tableau in R and render the results; this is aimed to be an introductory article, and hopefully will give you a good starting point for further exploration.
R Programming Language
R is a programming language and free software environment for statistical computing and graphics supported by the R Foundation for Statistical Computing. The R language is widely used among statisticians and data miners for developing statistical software and data analysis.
R was created by Ross Ihaka and Robert Gentleman at the University of Auckland, New Zealand, and is currently developed by the R Development Core Team (of which Chambers is a member); R is named partly after the first names of the first two R authors. The R project was conceived in 1992, with an initial version released in 1995 and a stable beta version in 2000
A list of changes in R releases is maintained in various “news” files at CRAN, but below is a list of milestones:
| Release | Date | Description |
| 0.16 | This is the last alpha version developed primarily by Ihaka and Gentleman. Much of the basic functionality from the “White Book” (see S history) was implemented. The mailing lists commenced on April 1, 1997. | |
| 0.49 | 23-Apr-1997 | This is the oldest source release which is currently available on CRAN. CRAN is started on this date, with 3 mirrors that initially hosted 12 packages. Alpha versions of R for Microsoft Windows and the classic Mac OS are made available shortly after this version |
| 0.60 | 05-Dec-1997 | R becomes an official part of the GNU Project. The code is hosted and maintained on CVS. |
| 0.65.1 | 07-Oct-1999 | First versions of update.packages and install.packages functions for downloading and installing packages from CRAN. |
| 1.0 | 29-Feb-2000 | Considered by its developers stable enough for production use. |
| 1.4 | 19-Dec-2001 | S4 methods are introduced and the first version for Mac OS X is made available soon after. |
| 2.0 | 04-Oct-2004 | Introduced lazy loading, which enables fast loading of data with minimal expense of system memory. |
| 2.1 | 18-Apr-2005 | Support for UTF-8 encoding, and the beginnings of internationalization and localization for different languages. |
| 2.11 | 22-Apr-2010 | Support for Windows 64 bit systems. |
| 2.13 | 14-Apr-2011 | Adding a new compiler function that allows speeding up functions by converting them to byte-code. |
| 2.14 | 31-Oct-2011 | Added mandatory namespaces for packages. Added a new parallel package. |
| 2.15 | 30-Mar-2012 | New load balancing functions. Improved serialisation speed for long vectors. |
| 3.0 | 03-Apr-2013 | Support for numeric index values 231 and larger on 64 bit systems. |
| 3.4 | 21-Apr-2017 | Just-in-time compilation (JIT) of functions and loops to byte-code enabled by default. |
| 3.5 | Packages byte-compiled on installation by default. Compact internal representation of integer sequences. Added a new serialisation format to support compact internal representations. |
R Programming Language: https://www.r-project.org
Wikipedia: https://en.wikipedia.org/wiki/R_(programming_language)
R Packages
The capabilities of R are extended through user-created packages, which allow specialised statistical techniques, graphical devices, import/export capabilities, reporting tools etc. A core set of packages is included with the installation of R, with more than 15,000 additional packages (as of September 2018) available at the Comprehensive R Archive Network (CRAN), Bioconductor, Omegahat, GitHub, and other repositories.
As of this article, a list of popular R Packages according to RDocumentation are:
| Package | Description |
| R6 | Creates classes with reference semantics, similar to R’s built-in reference classes. Compared to reference classes, R6 classes are simpler and lighter-weight, and they are not built on S4 classes so they do not require the methods package. These classes allow public and private members, and they support inheritance, even when the classes are defined in different packages. |
| ggplot2 | A system for ‘declaratively’ creating graphics, based on “The Grammar of Graphics”. You provide the data, tell ‘ggplot2’ how to map variables to aesthetics, what graphical primitives to use, and it takes care of the details. |
| devtools | Collection of package development tools. |
| dplyr | A fast, consistent tool for working with data frame like objects, both in memory and out of memory. |
| tidyverse | The ‘tidyverse’ is a set of packages that work in harmony because they share common data representations and ‘API’ design. This package is designed to make it easy to install and load multiple ‘tidyverse’ packages in a single step. |
| readxl | Import excel files into R. Supports ‘.xls’ via the embedded ‘libxls’ C library and ‘.xlsx’ via the embedded ‘RapidXML’ C++ library. This library works on Windows, Mac and Linux without external dependencies. |
| openssl | Bindings to OpenSSL libssl and libcrypto, plus custom SSH pubkey parsers. Supports RSA, DSA and EC curves P-256, P-384 and P-521. Cryptographic signatures can either be created and verified manually or via x509 certificates. |
| stringi | Allows for fast, correct, consistent, portable, as well as convenient character string/text processing in every locale and any native encoding. |
| data.table | Fast aggregation of large data (e.g. 100GB in RAM), fast ordered joins, fast add/modify/delete of columns by group using no copies at all, list columns, friendly and fast character-separated-value read/write. |
| pkgconfig | Set configuration options on a per-package basis. Options set by a given package only apply to that package, other packages are unaffected. |
| tidyr | An evolution of ‘reshape2’. It’s designed specifically for data tidying (not general reshaping or aggregating) and works well with ‘dplyr’ data pipelines. |
| Rcpp | The ‘Rcpp’ package provides R functions as well as C++ classes which offer a seamless integration of R and C++. Many R data types and objects can be mapped back and forth to C++ equivalents which facilitates both writing of new code as well as easier integration of third-party libraries. |
| readr | The goal of ‘readr’ is to provide a fast and friendly way to read rectangular data (like ‘csv’, ‘tsv’, and ‘fwf’). It is designed to flexibly parse many types of data found in the wild, while still cleanly failing when data unexpectedly changes. |
| sparklyr | R interface to Apache Spark, a fast and general engine for big data processing. This package supports connecting to local and remote Apache Spark clusters, provides a ‘dplyr’ compatible back-end, and provides an interface to Spark’s built-in machine learning algorithms. |
| yaml | Implements the ‘libyaml’ ‘YAML’ 1.1 parser and emitter for R. |
| utf8 | Process and print ‘UTF-8’ encoded international text (Unicode). Input, validate, normalize, encode, format, and display. |
| Glue | An implementation of interpreted string literals, inspired by Python’s Literal String Interpolation and Docstrings and Julia’s Triple-Quoted String Literals. |
| Lubridate | Functions to work with date-times and time-spans: fast and user friendly parsing of date-time data, extraction and updating of components of a date-time (years, months, days, hours, minutes, and seconds), algebraic manipulation on date-time and time-span objects. |
| Reshape2 | Flexibly restructure and aggregate data using just two functions: melt and ‘dcast’ (or ‘acast’). |
| tidyselect | A backend for the selecting functions of the ‘tidyverse’. It makes it easy to implement select-like functions in your own packages in a way that is consistent with other ‘tidyverse’ interfaces for selection. |
If you explore R, you will find that there are a lot of interesting packages available for use; a full list of the table above can be found here: https://www.rdocumentation.org.
Note: Leveraging R within Tableau is awesome, but if you have time, I would highly recommend you learn how to us R itself as there are lots of extremely cool things you can do with it.
R Studio
RStudio is a free and open-source integrated development environment (IDE) for R, a programming language for statistical computing and graphics. RStudio was founded by JJ Allaire, creator of the programming language ColdFusion. Hadley Wickham is the Chief Scientist at RStudio.
RStudio is available in two editions: RStudio Desktop, where the program is run locally as a regular desktop application; and RStudio Server, which allows accessing RStudio using a web browser while it is running on a remote Linux server. Prepackaged distributions of RStudio Desktop are available for Windows, macOS, and Linux.
RStudio is available in open source and commercial editions and runs on the desktop (Windows, macOS, and Linux) or in a browser connected to RStudio Server or RStudio Server Pro (Debian, Ubuntu, Red Hat Linux, CentOS, OpenSUSE and SLES).
Read more about RStudio here: https://www.rstudio.com
Rserve Package
Rserve acts as a socket server (TCP/IP or local sockets) which allows binary requests to be sent to R. Every connection has a separate workspace and working directory. Client-side implementations are available for popular languages such as C/C++ and Java, allowing any application to use facilities of R without the need of linking to R code. Rserve supports remote connection, user authentication and file transfer. A simple R client is included in this package as well.
To integrate Tableau with R, we will make use of the Rserve package.
Read more about Rserve here: https://www.rdocumentation.org/packages/Rserve
Getting Started
As with all our tutorials, let us first get started by downloading the required software and test the connectivity:
- Go to the R Project website and download the latest version of R: https://cran.r-project.org.
- I downloaded version 3.5.1 for Windows.
- When the download is completed, run the installation file.
- Go to the RStudio website and download the RStudio Desktop Open Source Edition: https://www.rstudio.com/products/rstudio.
- I downloaded version 1.1.463 for Windows.
- When the download is completed, run the installation file.
With the two key pieces of software installed:
- Start RStudio
- In the application menu, go to Tools and select Global Options.
- Ensure that the R version points to the directory that you have installed R.
- In the Console type in the following command to install the Rserve Package:
install.packages("Rserve")- This should attempt to install the Rserve package.
- If successful, Rserve will be installed into your R directory.
- Now we will load the Rserve packaged by entering the following command in the Console:
library(Rserve) - Now that Rserve is loaded, we start Rserve by entering the following command in the Console:
Rserve()
If all goes well you have now:
- Installed the R programming language.
- Installed RStudio Desktop Open Source Edition.
- Installed the Rserve package.
- Loaded the Rserve package.
- Started the Rserve process.
Now let us start Tableau Desktop and connect to the Rserve process:
- Open Tableau Desktop (version 8.1 or above).
- In Saved Data Sources, open the Sample – Superstore data source.
- In the application menu, go to Help, Settings and Performance, and click on Manage External Service Connections…
- In the External Service Connections dialogue window:
- In Select an External Service, make sure Rserve is selected.
- In Server enter localhost.
- In Port enter 6311.
- Click Test connection.
If all goes well, you will see Successfully connected to External Service which means you have now integrated Tableau with R. This is some cool stuff, but I think we will have more fun if we build a sample Tableau Dashboard which leverages this connection to R.
Worksheet
As this is an introductory article (more fun stuff will come later) we will build a very simple dashboard to demonstrate Tableau and R functionality. This means we are going to build a map of the US State and use R to perform kmean clustering.
With the Sample – Superstore dataset open:
- Drag State onto Detail.
- Change the Mark Type to Map.
- Create a Parameter called Cluster Size
- Set Data type to Integer.
- Set Current value to 4.
- Set Allowable values to Range.
- Set Minimum to 2.
- Set Maximum to 10.
- Click Ok.
Now we are going to create a Calculated field called Cluster:
SCRIPT_INT('result <- kmeans(x = data.frame(.arg1,.arg2,.arg3), '+STR([Cluster Size])+')result$cluster',SUM([Profit]),SUM([Sales]),SUM([Quantity]))
Let us dig into this a bit:
- The SCRIPT_INT table calculation returns an integer result from the specified expression. The expression is passed directly to a running external service instance.
- We also have SCRIPT_BOOL, SCRIPT_REAL and SCRIPT_STR for different data types.
- We are passing the Cluster Size parameter into the R expression and will need to cast this as a string using STR.
- We are passing in several aggregated functions that will map to .argX in the R expression.
Now to finish off our worksheet:
- Right-click on Cluster and select Convert to Discrete.
- Drag Cluster onto Color. You will get an error message but do not worry about this.
- Right-click on Cluster, go to Computer Using and select State.
You should have something like the following:
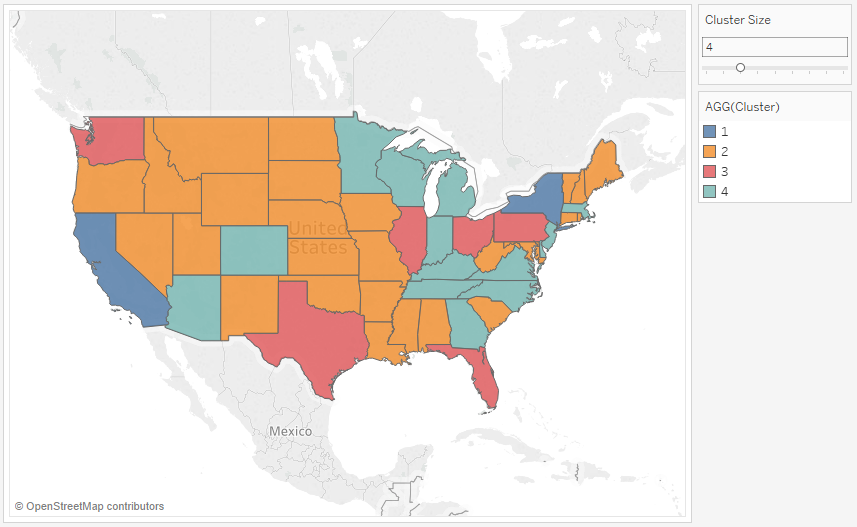
And there you have it, boom, you now have a Tableau Worksheet that draws out all 50 states and uses R to perform a kmean cluster based on Profit, Sales and Quantity to give a color. Feel free to change the number of clusters and observe the results, or better yet, check out the vast library of available R packages and functions.
Summary
In future articles on R, I will go through some really cool things you can do such as Sentiment Analysis, Identifying outliers, additional clustering methods to name a few.
I hope you all enjoyed this article as much as I enjoyed writing it. Do let me know if you experienced any issues integrating Tableau and R, and as always, please leave a comment below or reach out to me on Twitter @Tableau_Magic, till next time, Have fun with Tableau.
If you like our work, do consider supporting us on Patreon, and for supporting us, we will give you early access to tutorials, exclusive videos, as well as access to current and future courses on Udemy:
- Patreon: https://www.patreon.com/tableaumagic
Also, do be sure to check out our various courses:
- Creating Bespoke Data Visualizations (Udemy)
- Introduction to Tableau (Online Instructor-Led)
- Advanced Calculations (Online Instructor-Led)
- Creating Bespoke Data Visualizations (Online Instructor-Led)