

I have been working on several dashboards for the end of the Premier League 2019/2020 Season and I thought that I would create a Win-Loss Chart and give you all a quick tip. We are going to build a few variations in the next 10 minutes.
Data
We will start by loading the following data into Tableau Desktop / Tableau public.
Week,Team,Opposition,Result,Scoreline
1,Arsenal,Newcastle United,Win,1-0
2,Arsenal,Burnley,Win,2-1
3,Arsenal,Liverpool,Loss,1-3
4,Arsenal,Tottenham Hotspur,Draw,2-2
5,Arsenal,Watford,Draw,2-2
6,Arsenal,Aston Villa,Win,3-2
7,Arsenal,Manchester United,Draw,1-1
8,Arsenal,Bournemouth,Win,1-0
9,Arsenal,Sheffield United,Loss,0-1
10,Arsenal,Crystal Palace,Draw,2-2
11,Arsenal,Wolverhampton Wanderers,Draw,1-1
12,Arsenal,Leicester City,Loss,0-2
13,Arsenal,Southampton,Draw,2-2
14,Arsenal,Norwich City,Draw,2-2
15,Arsenal,Brighton and Hove Albion,Loss,1-2
16,Arsenal,West Ham United,Win,3-1
17,Arsenal,Manchester City,Loss,0-3
18,Arsenal,Everton,Draw,0-0
19,Arsenal,Bournemouth,Draw,1-1
20,Arsenal,Chelsea,Loss,1-2
21,Arsenal,Manchester United,Win,2-0
22,Arsenal,Crystal Palace,Draw,1-1
23,Arsenal,Sheffield United,Draw,1-1
24,Arsenal,Chelsea,Draw,2-2
25,Arsenal,Burnley,Draw,0-0
26,Arsenal,Newcastle United,Win,4-0
27,Arsenal,Everton,Win,3-2
28,Arsenal,Manchester City,Loss,0-3
29,Arsenal,West Ham United,Win,1-0
30,Arsenal,Brighton and Hove Albion,Loss,1-2
31,Arsenal,Southampton,Win,2-0
32,Arsenal,Norwich City,Win,4-0
33,Arsenal,Wolverhampton Wanderers,Win,2-0
34,Arsenal,Leicester City,Draw,1-1
Note: We are going to use Arsenal’s data for this tutorial.
Calculated Fields
We only need to create the following Calculation Fields:
Win-Loss
CASE [Result]
    WHEN "Win" THEN 1.0
    WHEN "Draw" THEN 0.0
    WHEN "Loss" THEN -1.0
END
Team Score
INT(TRIM( SPLIT( [Scoreline], "-", 1 ) ))Opposition Score
INT(TRIM( SPLIT( [Scoreline], "-", 2 ) ))With this done, let us start creating our data visualisation.
Worksheet
We will now build our first worksheet:
- Change the Mark Type to Circle
- Drag Week onto the Columns Shelf
- Right-click on this pill and ensure it is a Discete Dimension
- Drag Result onto the Colour Mark
- Drag Team, Opposition, Result and Scoreline onto the Tool Tip Mark and edit
- Edit the Color
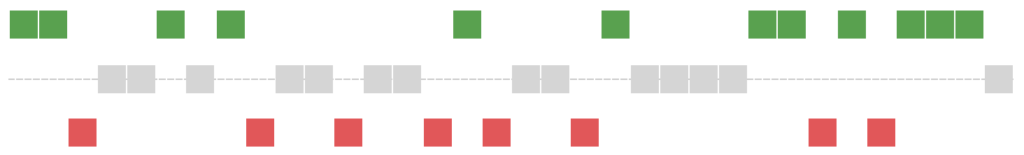
You should now see the following:


Nice and simple huh, we are now going to create our second variation:
- Right-click on our preview Sheet and select Duplicate
- Change the Mark Type to Square
- Drag Win-Loss onto the Rows Shelf
- Format until you are happy
You will want to see the following:

As you can see we are using adding some extra information to our visualisation. However, we are going to build our final variation, which is something a little more experimental:
- Create a New Worksheet
- Change the Mark Type to Line
- Drag Week onto the Columns Shelf; ensure that Week is set as a Discrete Dimension
- Drag Measure Values onto the Rows Shelf
- Remove all but the Opposition Score and Team Score
- Double click on the Opposition Score and add a – sign (this is inline editing)
- Drag Measure Names onto the Path Mark
- Drag Team, Opposition, Result and Scoreline onto the Tool Tip Mark and edit
- Edit the Color
We will want to have the following:

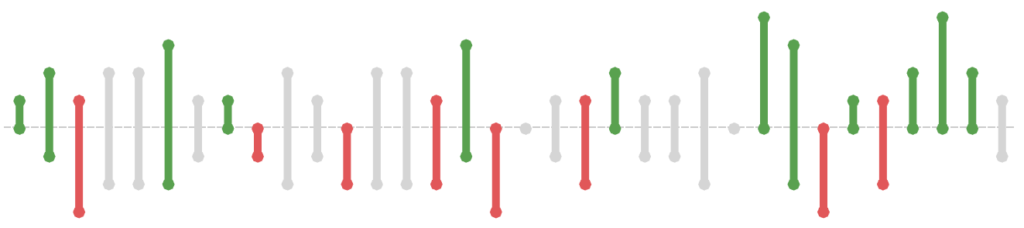
In this chart, the colour indicates the Win, Loss or Draw. Above the zero line shows how many goals Arsenal Scores, below the line shows how many goals that the opposition scored. As you can see, this is a bit of an experiment to see if we can get more information into our data visualisation.
and boom, we are done with this Tableau Quick Tip, and I hope you had some seriously good fun; as always, you can find my data visualisation on Tableau Public at https://public.tableau.com/profile/toan.hoang#!/vizhome/WinLossCharts/WinLossChart
Summary
I hope you all enjoyed this article as much as I enjoyed writing it and as always do share the love. Do let me know if you experienced any issues recreating this Visualization, and as always, please leave a comment below or reach out to me on Twitter @Tableau_Magic. Do also remember to tag me in your work if you use this tutorial.