Video: Tableau with Music / Control Charts
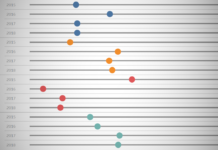
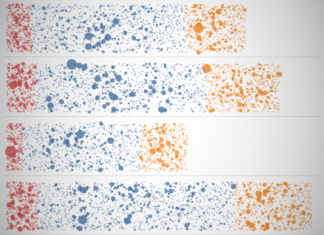
Using a few neat tricks and some Table Calculations, we have created this awesome chart in Tableau. Enjoy.
https://youtu.be/2qQvQNtCUzY
YouTube Channel
Written Tutorial
Tableau QT: Rounded Gantt Chart
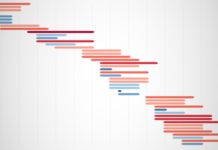
Something very nice and simple, here is a Tableau Quick Tip on Creating a Rounded Gantt Chart within 10 minutes or less.
Note: This is an alternative type of data visualisation, and...
Tableau QT: Podium Bar Chart
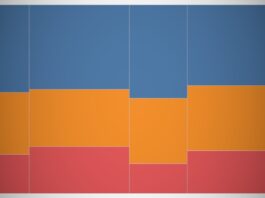
Thinking about the olympics and podiums, so here is a Tableau Quick Tip on Creating a Podium Bar Chart within 10 minutes or less.
Note: This is an alternative type of data...
Tableau QT: Sketchy Bar Chart
I am slowly completing the second wave of Tableau Tutorials, so I hope that you enjoy this 10-min Tableau Quick Tip and a little bit of fun.
Note: I see absolutely no...
Tableau QT: Win-Loss Charts
I have been working on several dashboards for the end of the Premier League 2019/2020 Season and I thought that I would create a Win-Loss Chart and give you all a...
Tableau QT: US Hex Map
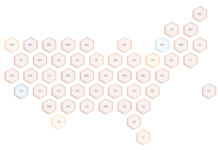
I actually wrote this tutorial a few years ago, but when I migrated to Tableau Magic, I did not bring this across for some reason. In this Quick Tip (QT) we...
Video: Tableau with Music / Bar Trend Chart
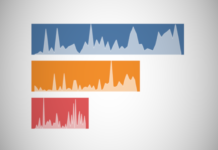
Using a few neat tricks and some Table Calculations, we have created this awesome chart in Tableau. Enjoy.
https://youtu.be/8nVY98Ouupg
Written Tutorial
YouTube Channel
Tableau QT: Waffle Image
I thought that this week's Tableau Quick Tip will be something a little different and fun, so here you go, our Waffle Image in Tableau.
Note: This is an alternative type of...
Tableau QT: Wilkinson Plot
I wanted to have some fun, so I put together a quick tutorial for creating a Wilkinson Plot in Tableau, and within 10 minutes or less.
Note: This is an alternative type...
Video: Tableau with Music / Volume Dial Charts
This is something extremely easy and quick to create. Enjoy.
https://youtu.be/vrTEdoJKsNk
Written Tutorial
YouTube Channel


