Tableau QT: Podium Bar Chart
Thinking about the olympics and podiums, so here is a Tableau Quick Tip on Creating a Podium Bar Chart within 10 minutes or less.
Note: This is an alternative type of data...
Tableau QT: Jitter Stacked Bar Chart
I wanted to work on creating a tutorial on a Jitter Pie Chart but I was getting creative block, so therefore, I decided to take a step back and try for...
Tableau QT: Rounded Gantt Chart
Something very nice and simple, here is a Tableau Quick Tip on Creating a Rounded Gantt Chart within 10 minutes or less.
Note: This is an alternative type of data visualisation, and...
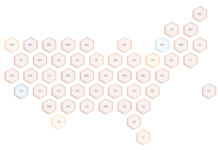
Tableau QT: US Hex Map
I actually wrote this tutorial a few years ago, but when I migrated to Tableau Magic, I did not bring this across for some reason. In this Quick Tip (QT) we...
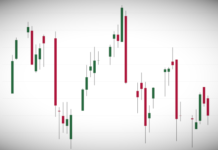
Drawing Candlestick Charts in Tableau
I have been doing alot of research for an article that I am writting about the Salesforce Acquisition of Tableau. As such, I was looking at the Stock Prices and thought...
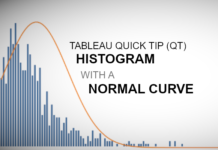
Tableau QT: Histogram with Normal Curve
Welcome to 2020. Hopefully, this will be the start of a glorious year, and we at Tableau Magic are definitely excited for things to come. Here is our first Tableau Quick...
Tableau QT: OHLC Charts
In this Tableau Quick Tip, we are going to create an Open-High-Low-Close (OHLC) chart in Tableau, we will do this within 5 mins or less.
Data
Let us start by loading the following...
Hex Maps in Tableau
I have always had a thing for Hex Maps, so I decided to finally write a tutorial on how you can generate some very interesting Hex Maps. With the help of...
Tableau QT: Win-Loss Charts
I have been working on several dashboards for the end of the Premier League 2019/2020 Season and I thought that I would create a Win-Loss Chart and give you all a...
Tableau QT: Filled Square Charts
In this Tableau quick tip, we are going to walk through the creation of a Filled Square Chart in Tableau in 5 minutes or less. Something very simple and fun. ...


