Cryptocurrency Dashboard Full Tutorial
Once a month, I am going to write a full feature-length tutorial on creating an intricate multi-feature dashboard for you to work through and enjoy. We are going to start with...
Flow Chart Template
As a Tableau Zen Master, I volunteered time to support non-profit organisations. One of the organisations had an interesting requirement, and as this was static one-off data visualisation, I decided to...
Drawing Candlestick Charts in Tableau
I have been doing alot of research for an article that I am writting about the Salesforce Acquisition of Tableau. As such, I was looking at the Stock Prices and thought...
Tableau QT: Bar Chart with Floating Icons
Requested from a student, here is a Tableau Quick Tip (QT) on creating a Bar Chart with a floating icons. So in 5 minutes or less, we are going to build...
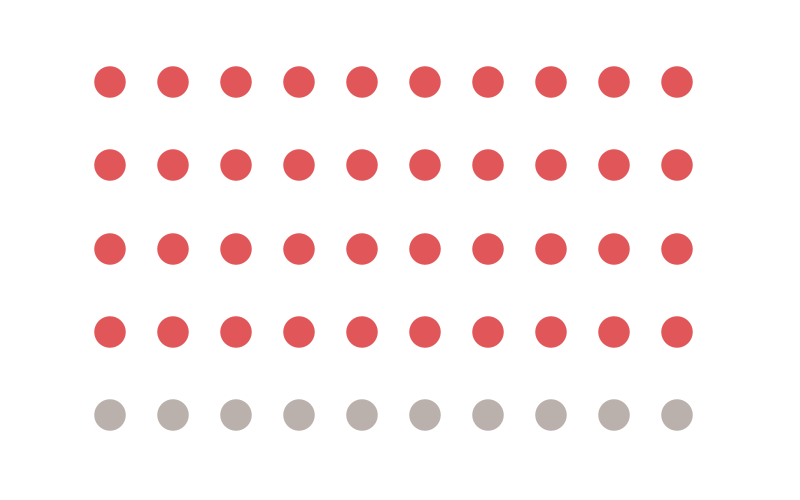
Dot Matrix Tutorial
A friend messaged me to ask he could create a grid layout for different visualisations, for example, a 3×3 grid. I immediately thought about a Dot Matrix visualization and how I could create...
Create a Bar Chart (Textured) in Tableau
Requested by a student, here is a tutorial on adding Textures to Bar Charts to create a very nice and interesting effect. This uses data densification as well as images in...
Tableau QT: Negative Space Bar Charts
We are going to have and hopefully learn a simple and effective technique. In this Tableau quick tip, we are going to walkthrough the creation of a Negative Space Bar Chart...
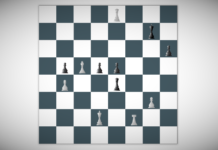
Animated Chess Tutorial in Tableau
I was looking for a new hobby during the COVID lockdowns, so I decided to go back to my childhood and to check out Magic the Gathering; if you do not...
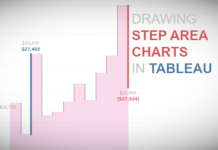
Drawing Step Area Charts in Tableau
Step Line Charts have been introduced with Tableau’s 2018.1 release and it’s really hard to remember that there was a time before, where it needed a little hack to create such...
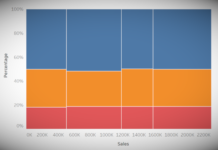
Creating a Marimekko Chart in Tableau
To close off there year, he is a quick and simple tutorial on creating a Marimekko Chart in Tableau. No data densification or any such data tricks. Just a few Table...


