
Step Line Charts have been introduced with Tableau’s 2018.1 release and it’s really hard to remember that there was a time before, where it needed a little hack to create such a step line.
For the Area mark, we haven’t got the same options to create Step Area Charts yet. During Ludovic Tavernier‘s and my talk at TCE in Berlin some weeks ago I demoed how to create them using one extra copy of the data, and I also described the how-to in a blog post on my blog vizjockey.com.
After my presentation in Berlin, I talked to Ann Jackson about my Step Area Chart and she was wondering (I assume she was already knowing) if there was a way to create such a chart without doubling the data and using table calculations instead. Well, Ann – you were (of course) right!
This blog post will guide you through the steps to create a Step Area Chart without any data prep – I hope you will enjoy this!
Data
Load the following data into Tableau Desktop / Tableau Public.
Note: If you have Tableau Desktop, please use the Sample Superstore Data Source.
Implementation Concept
In our Step Area Chart, we want to visualize 2018 Superstore sales by month.
To create a Step Area Chart, you basically have to draw a Step Line manually (and then change the mark to area mark). To do this, we add for each month the previous sales to get the step line. (Make sure to check out Rody Zakovich‘s blogpost CREATE A STEP CHART IN TABLEAU WITHOUT DATA MODELING to learn more about this technique.)

Calculated Fields
Previous Sales
IFNULL(LOOKUP(SUM([Sales]),-1),SUM([Sales]))Difference Sales
IFNULL(ZN(SUM([Sales])) - LOOKUP(ZN(SUM([Sales])), -1),0)Sales Calculated
[Previous Sales]+[Difference Sales]Worksheet
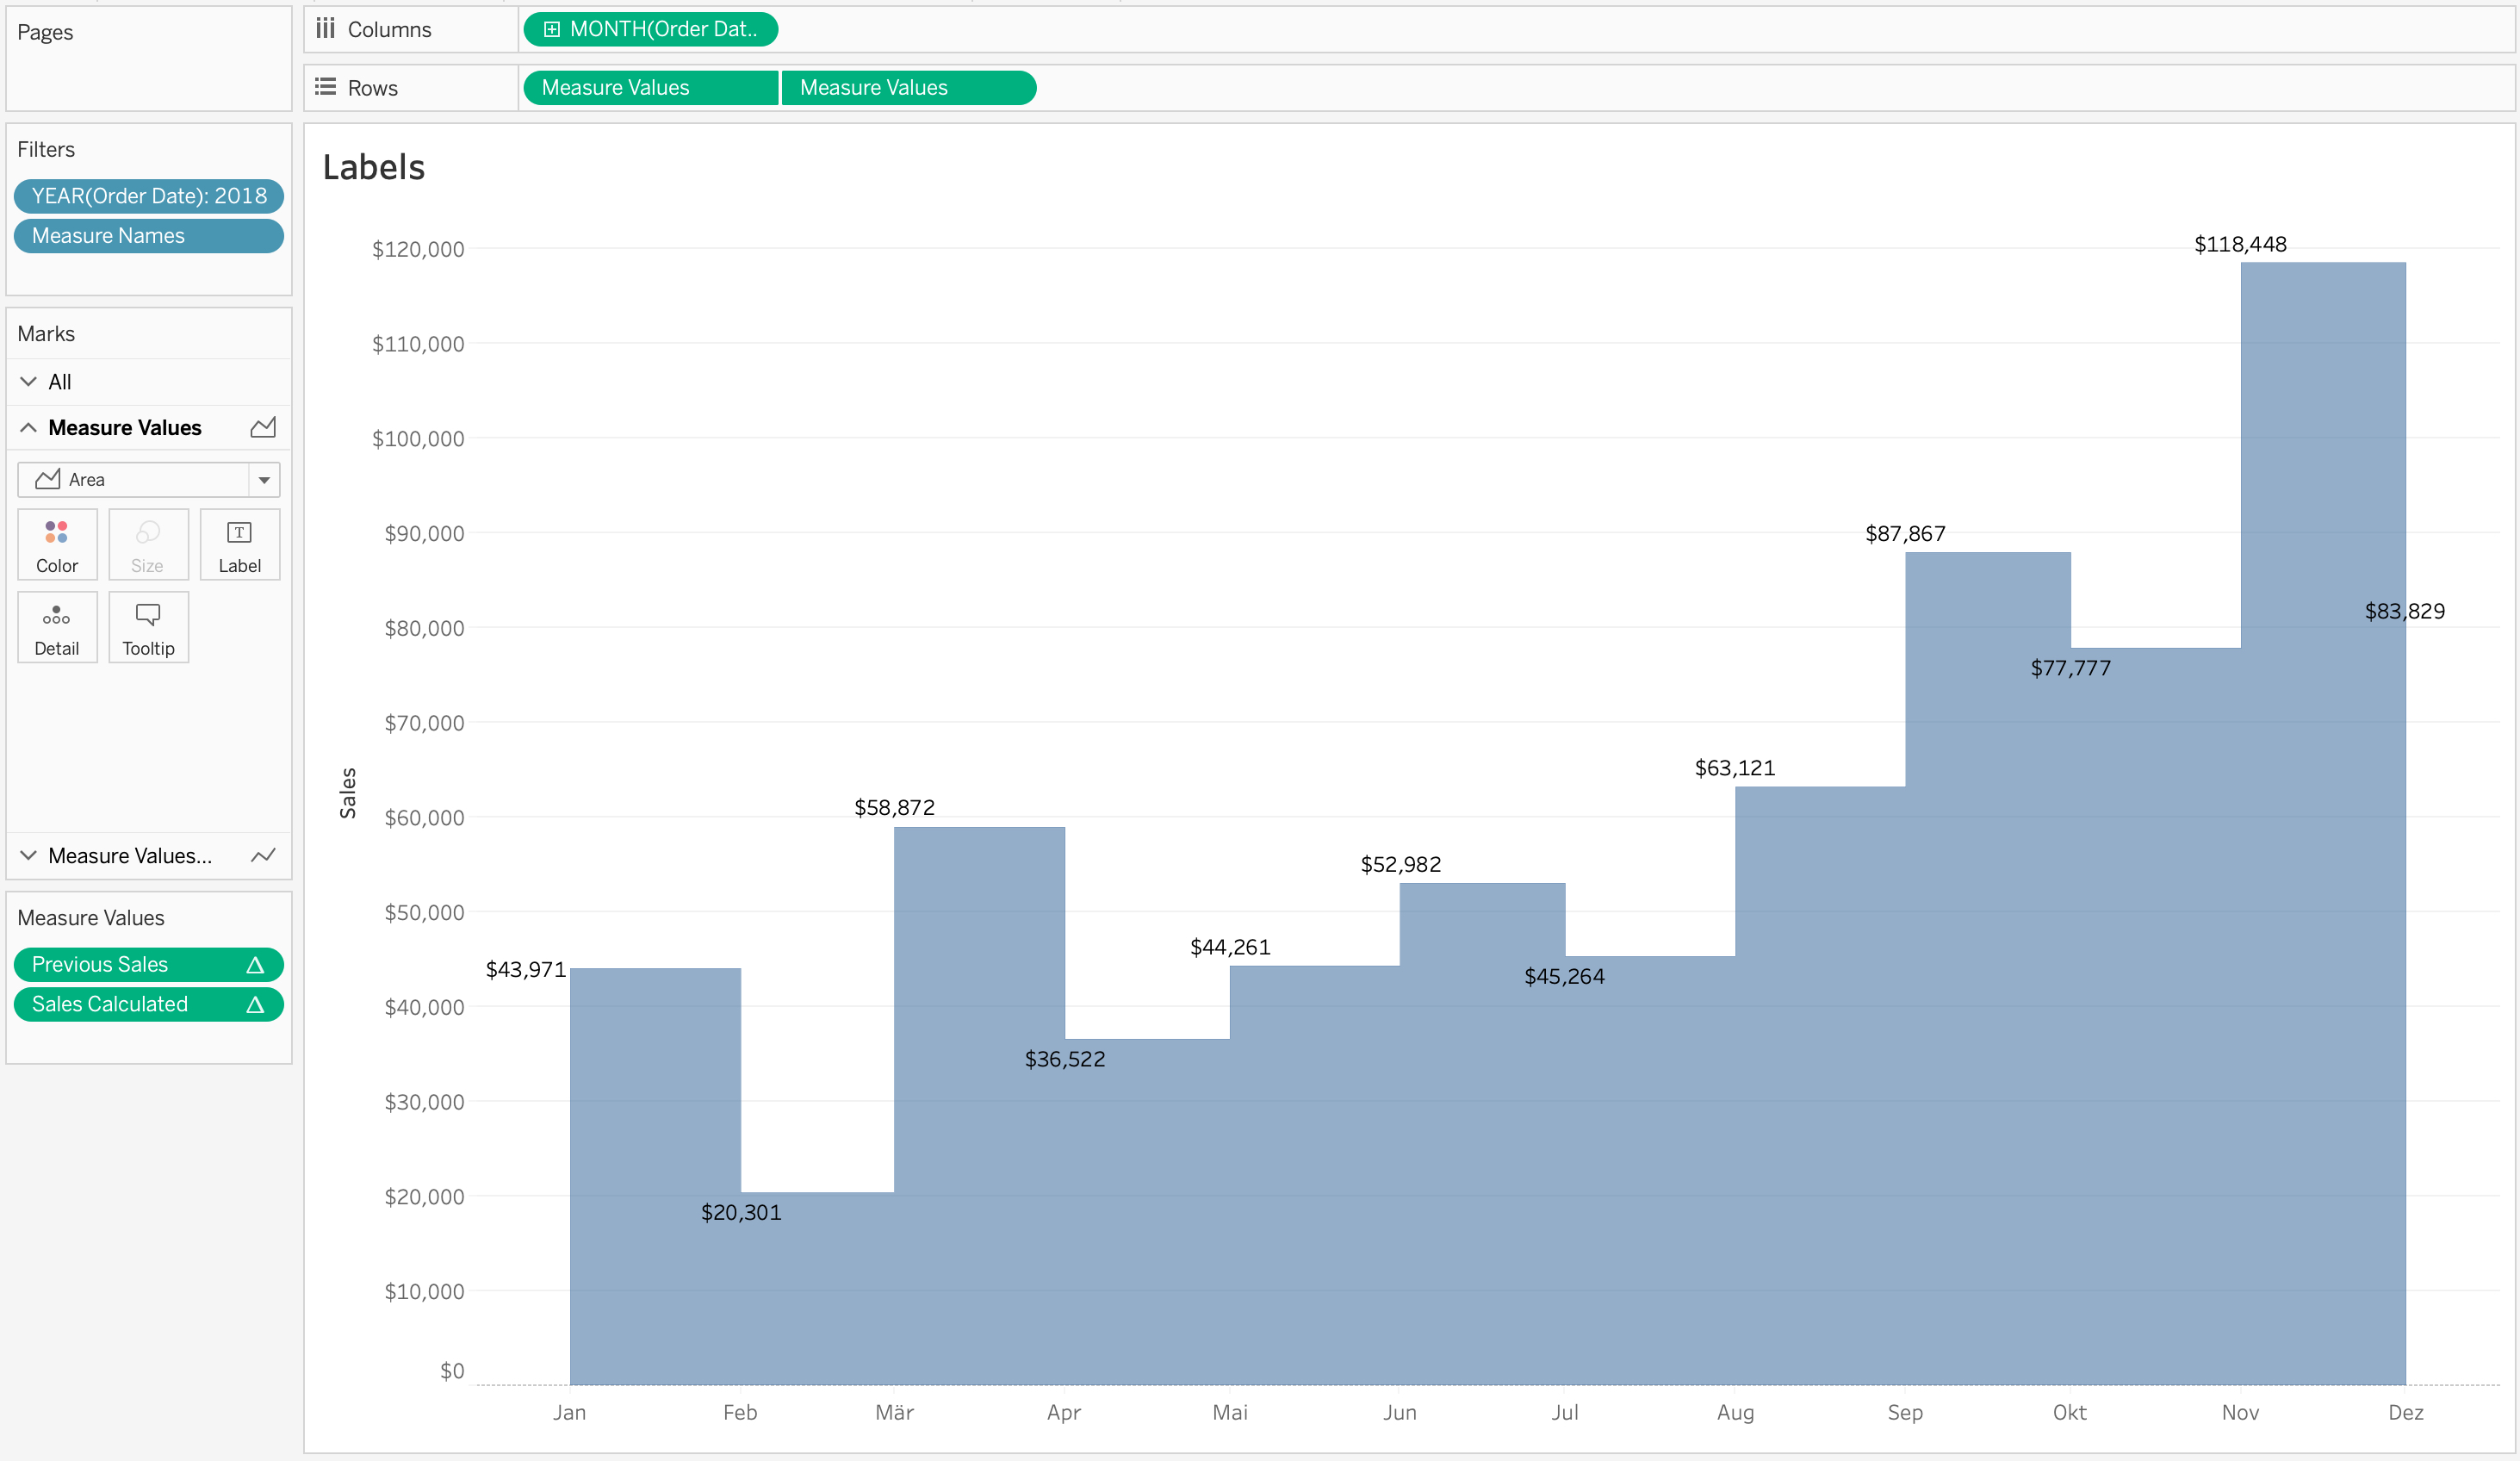
With just these three calculations we are now able to draw our Step Area Chart:
- Drag continuous MONTH(Order Date) on Columns
- Drag Previous Sales on Rows
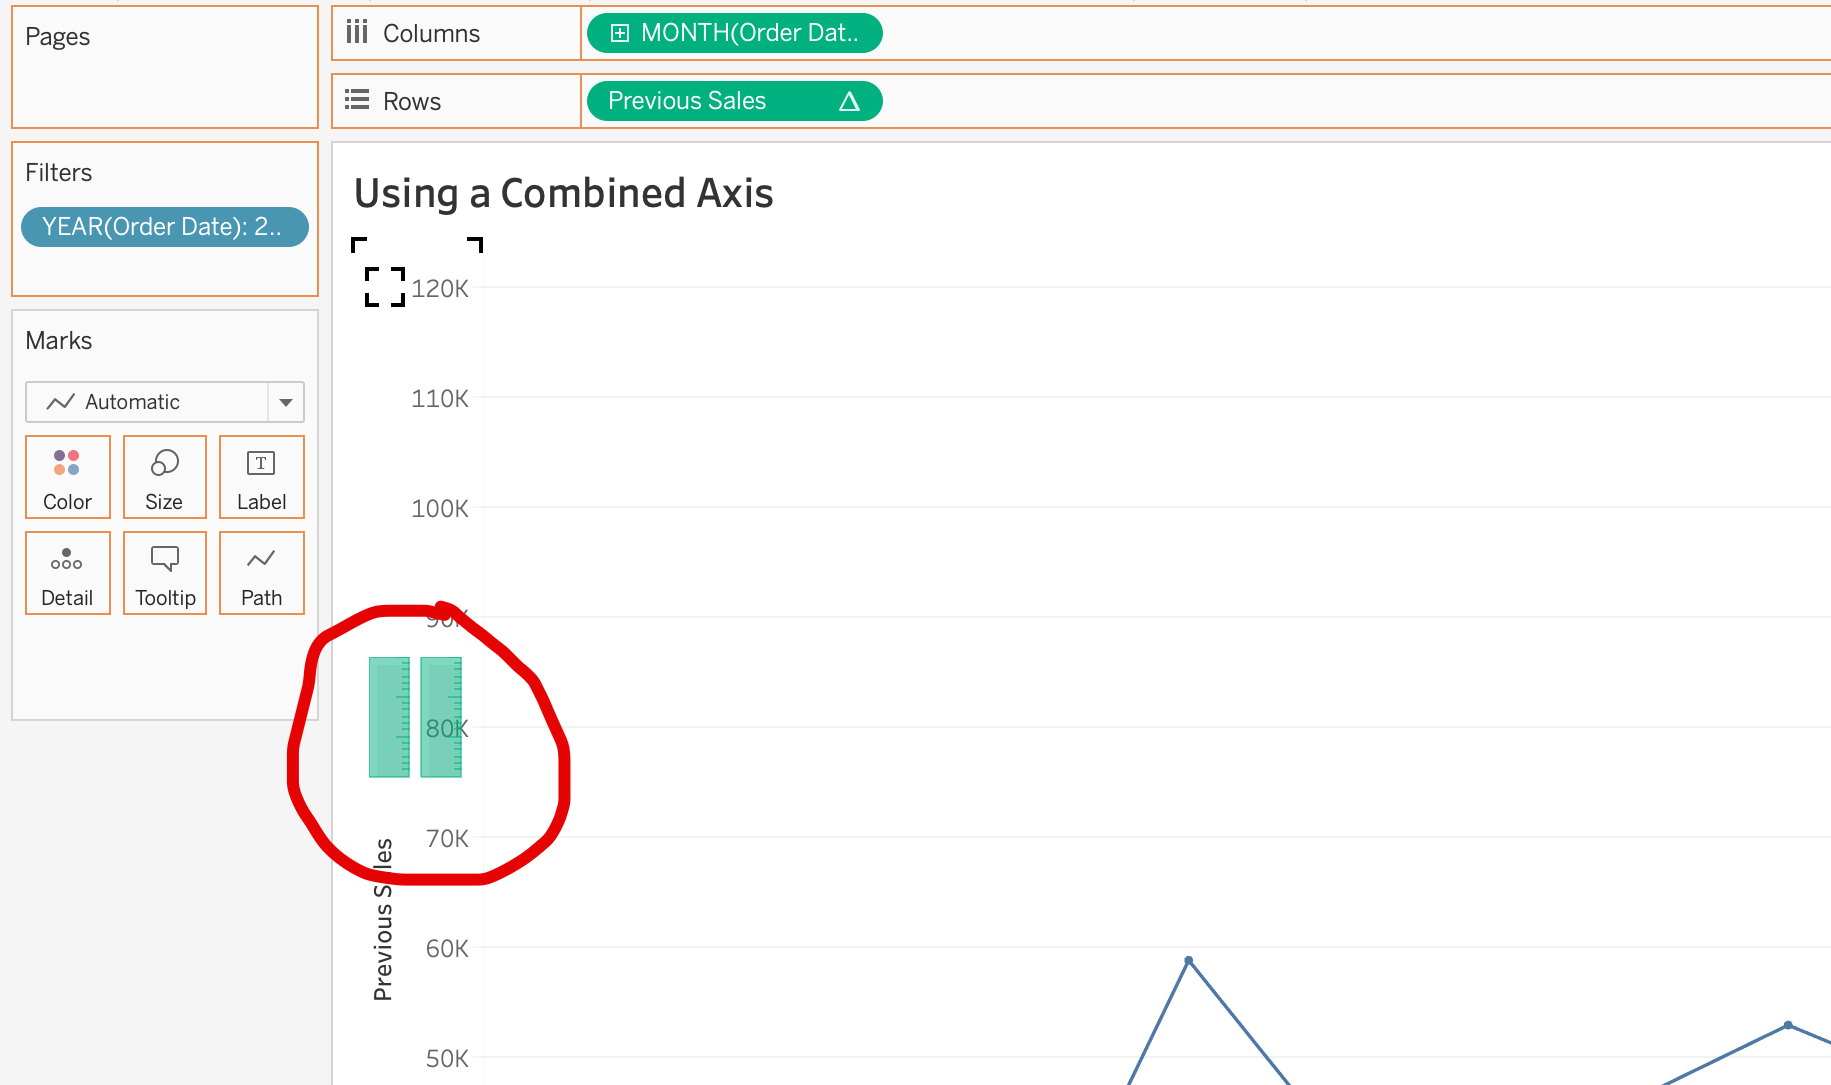
- Drag Sales Calculated on the Previous Sales axis until you see two parallel green bars, and let the field drop – this will create a combined axis and Measure Values will appear in the green pill on the rows shelf
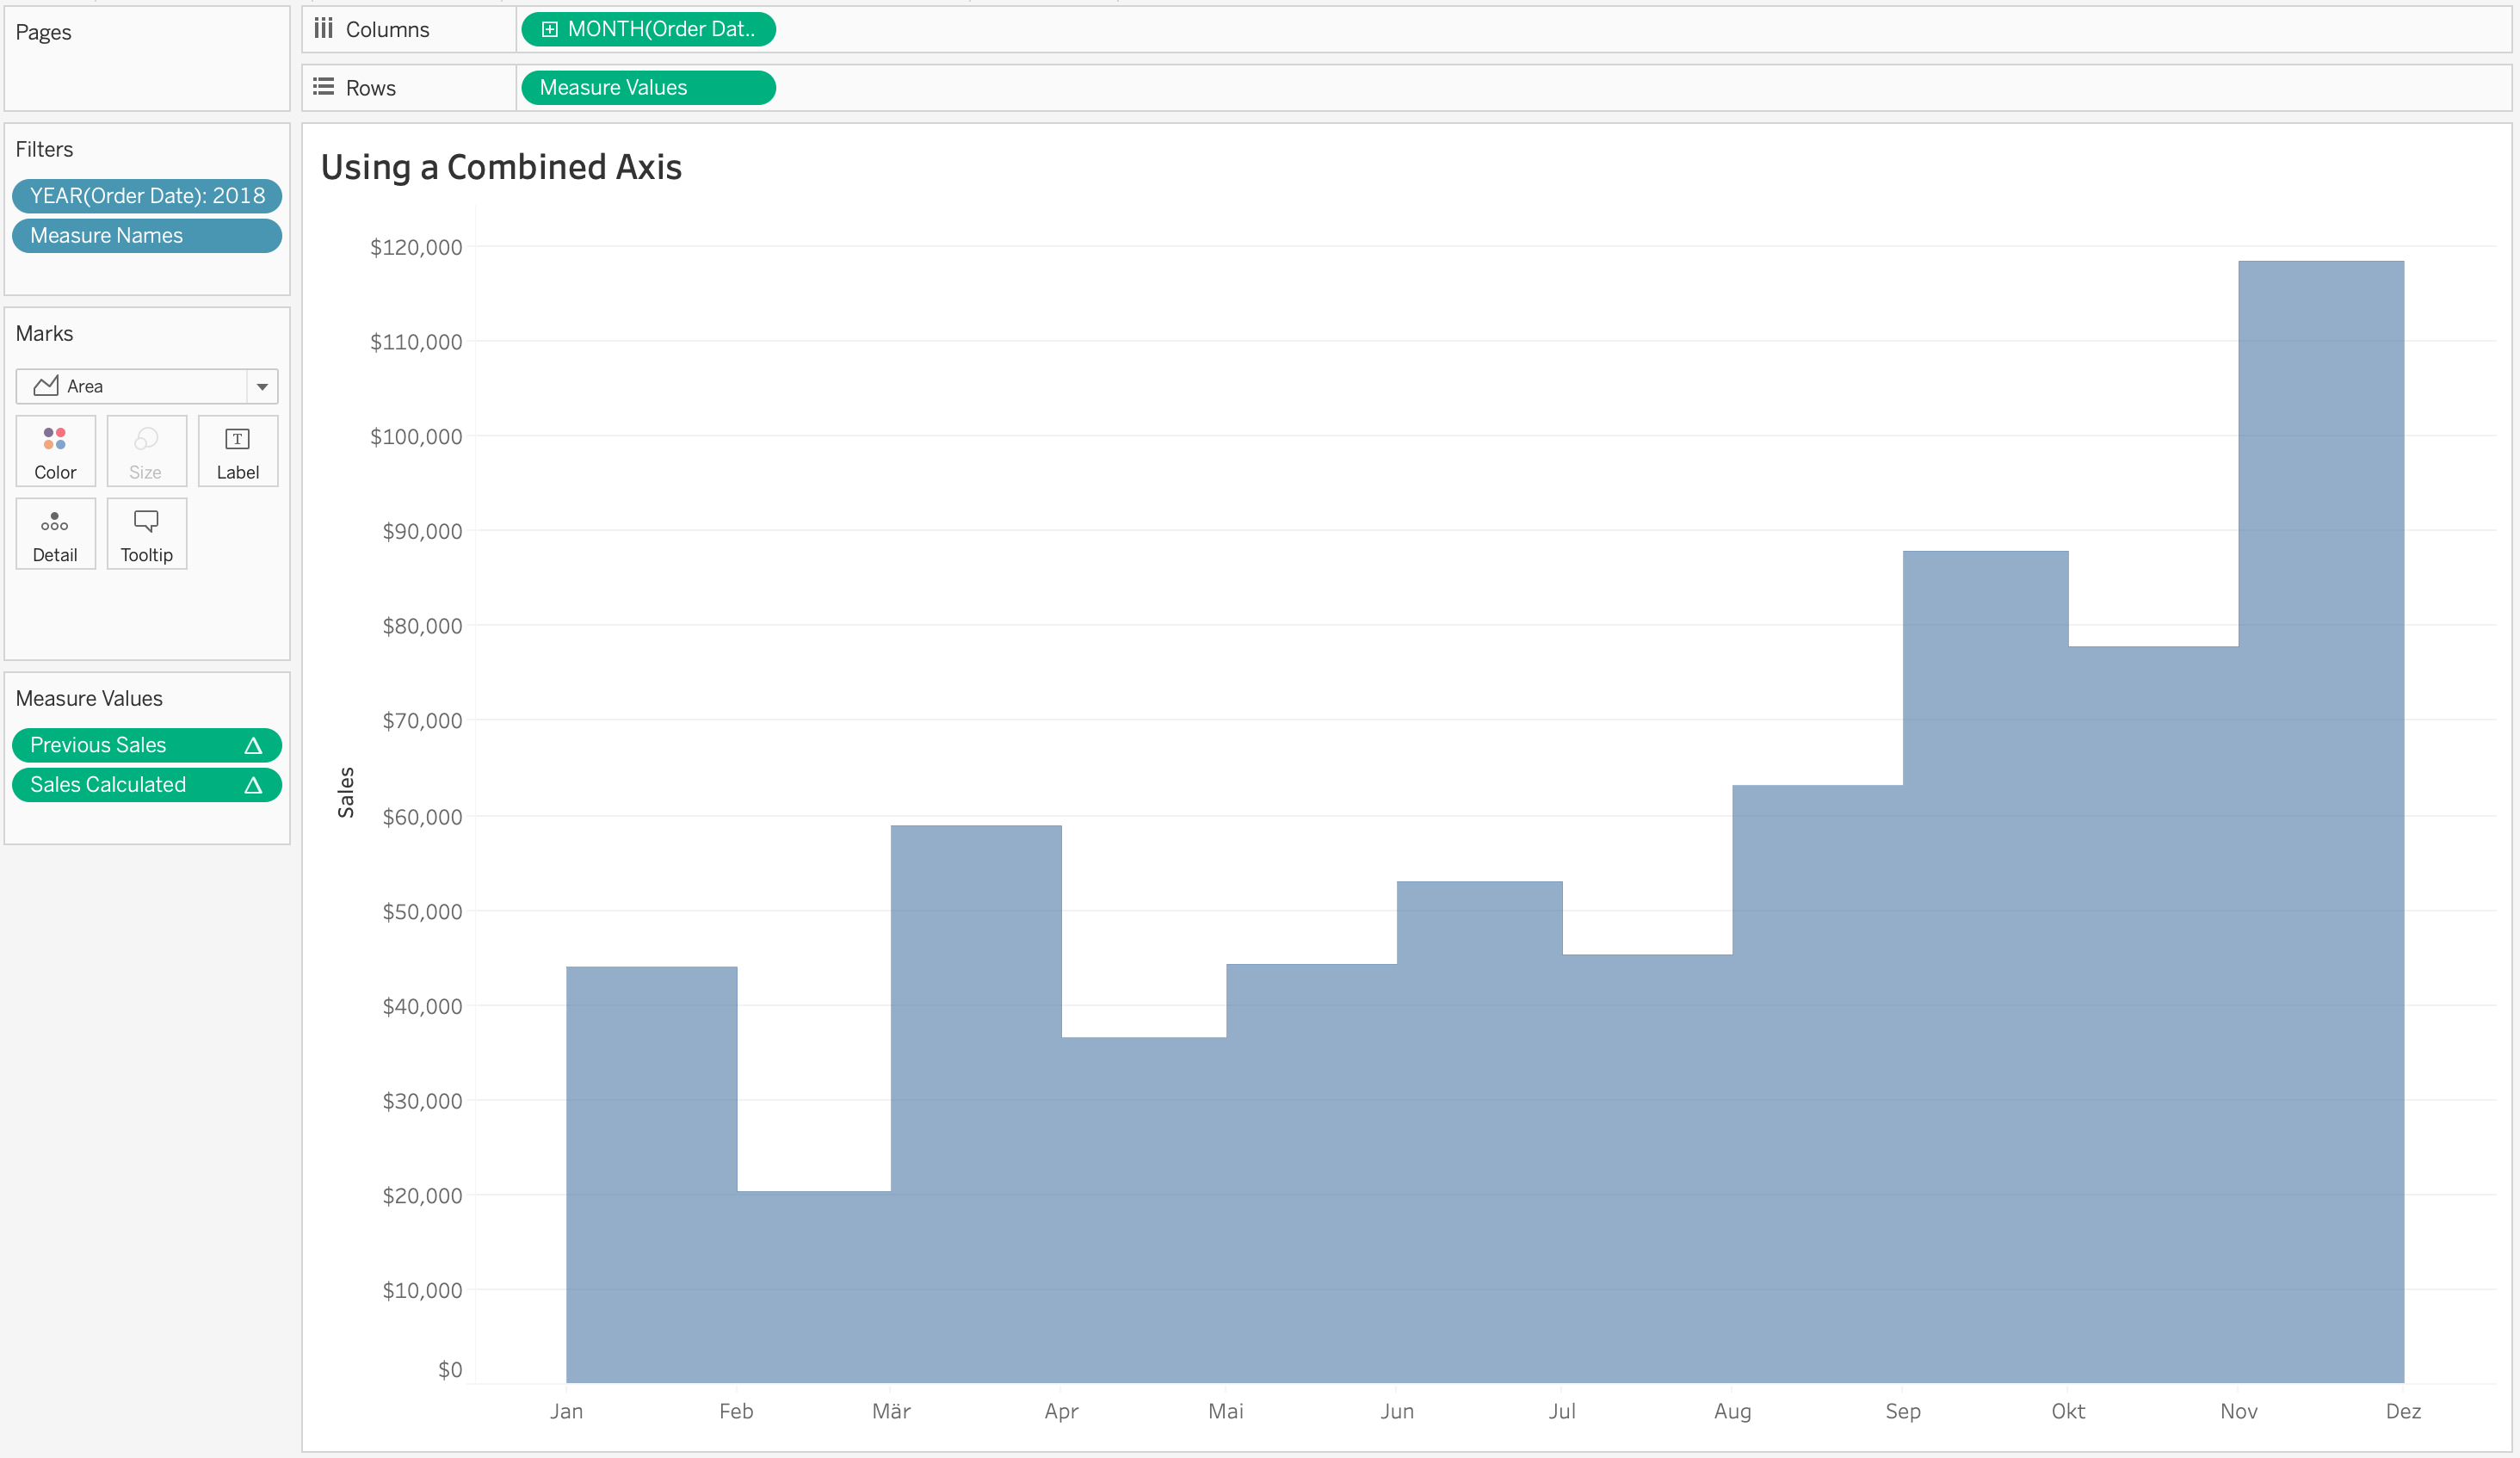
- Measure Names will have been added to the color shelf automatically. You can get rid of it and you will see a step line.
- Change the mark type to the Area mark and you will see the following.


Nice 🙂
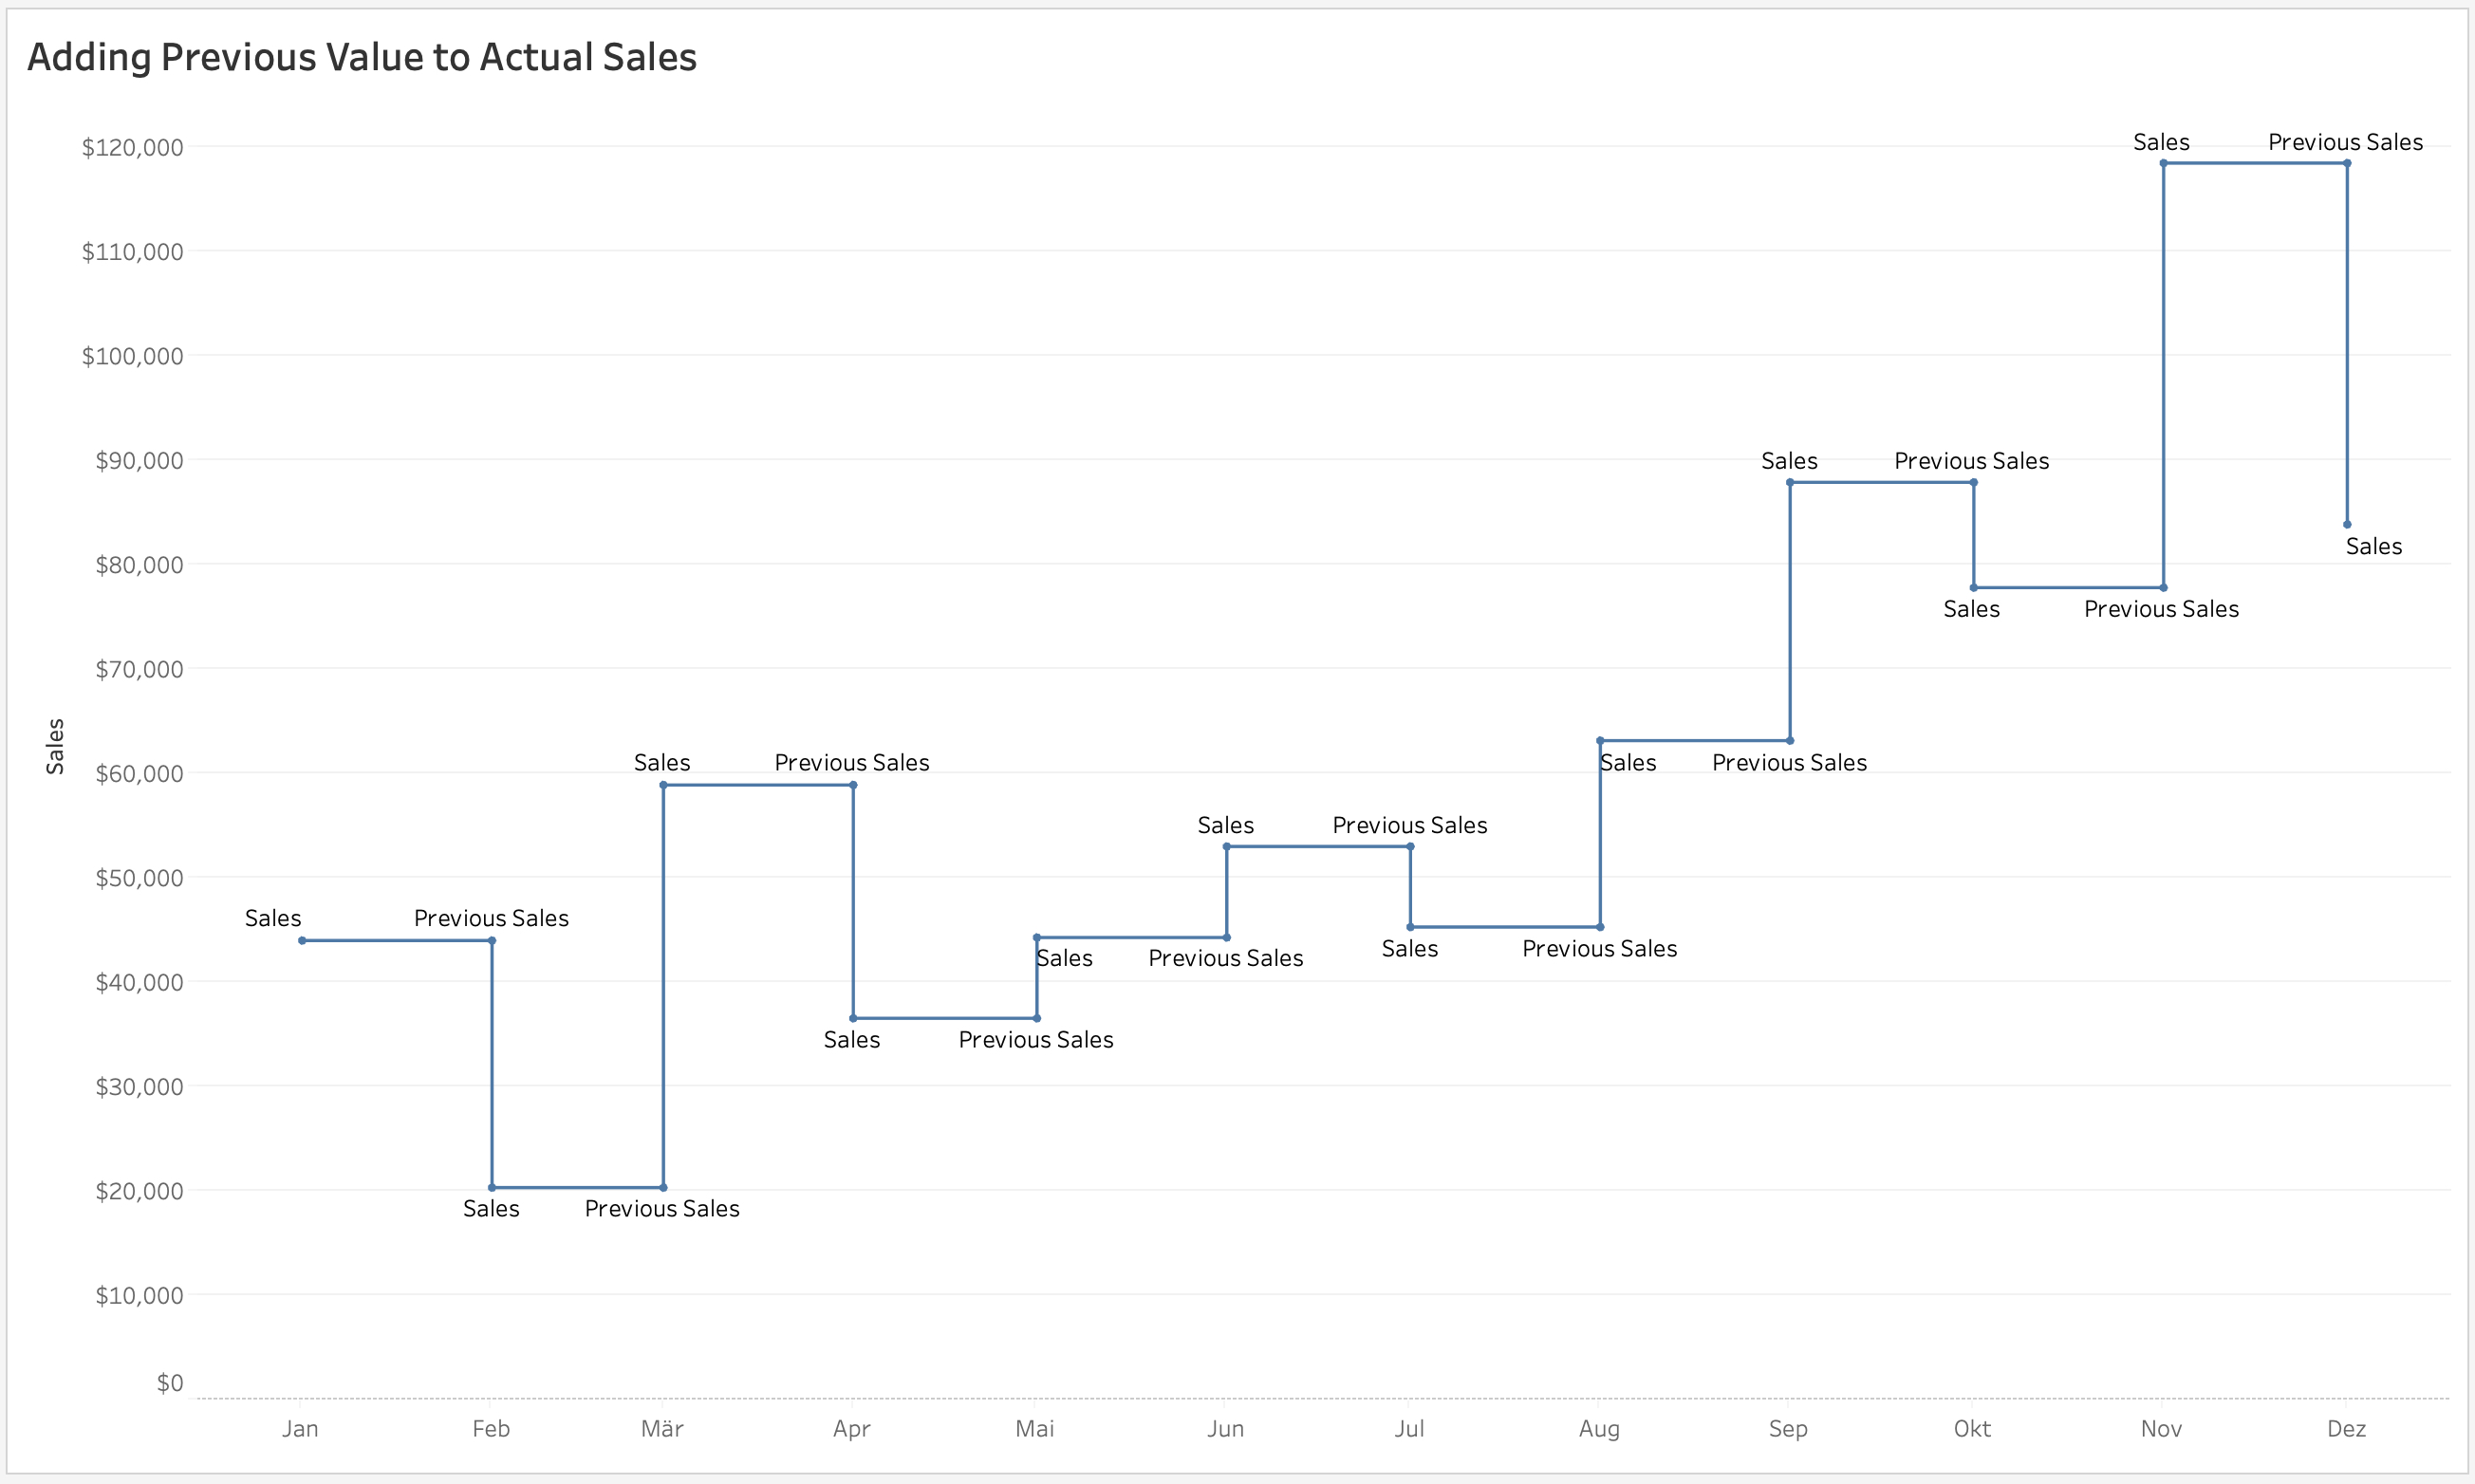
To label my Step Area Charts, I like to create a dual-axis, where I choose the line mark, YEAR(Order Date) on Path and continuous MONTH(Order Date) on detail to create vertical lines for each month. You can then add sales to the label card and label only the line ends. This will only label the actual sales for each month.

Summary
The tricky part for the Step Area Chart is, that we cannot use Path to define the order, in which the marks have to be connected (previous sales first, then actual sales for each month). This is due to the missing Path card for the Area mark:

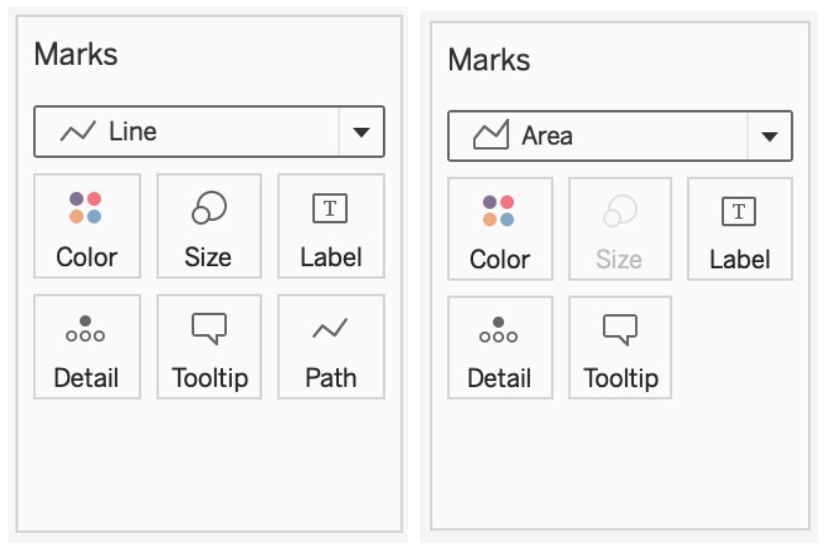
That’s why we have to use Sales Calculated instead of a simple sum(Sales). Both measures have identical values, but the Step Area Chart just won’t work with the latter.
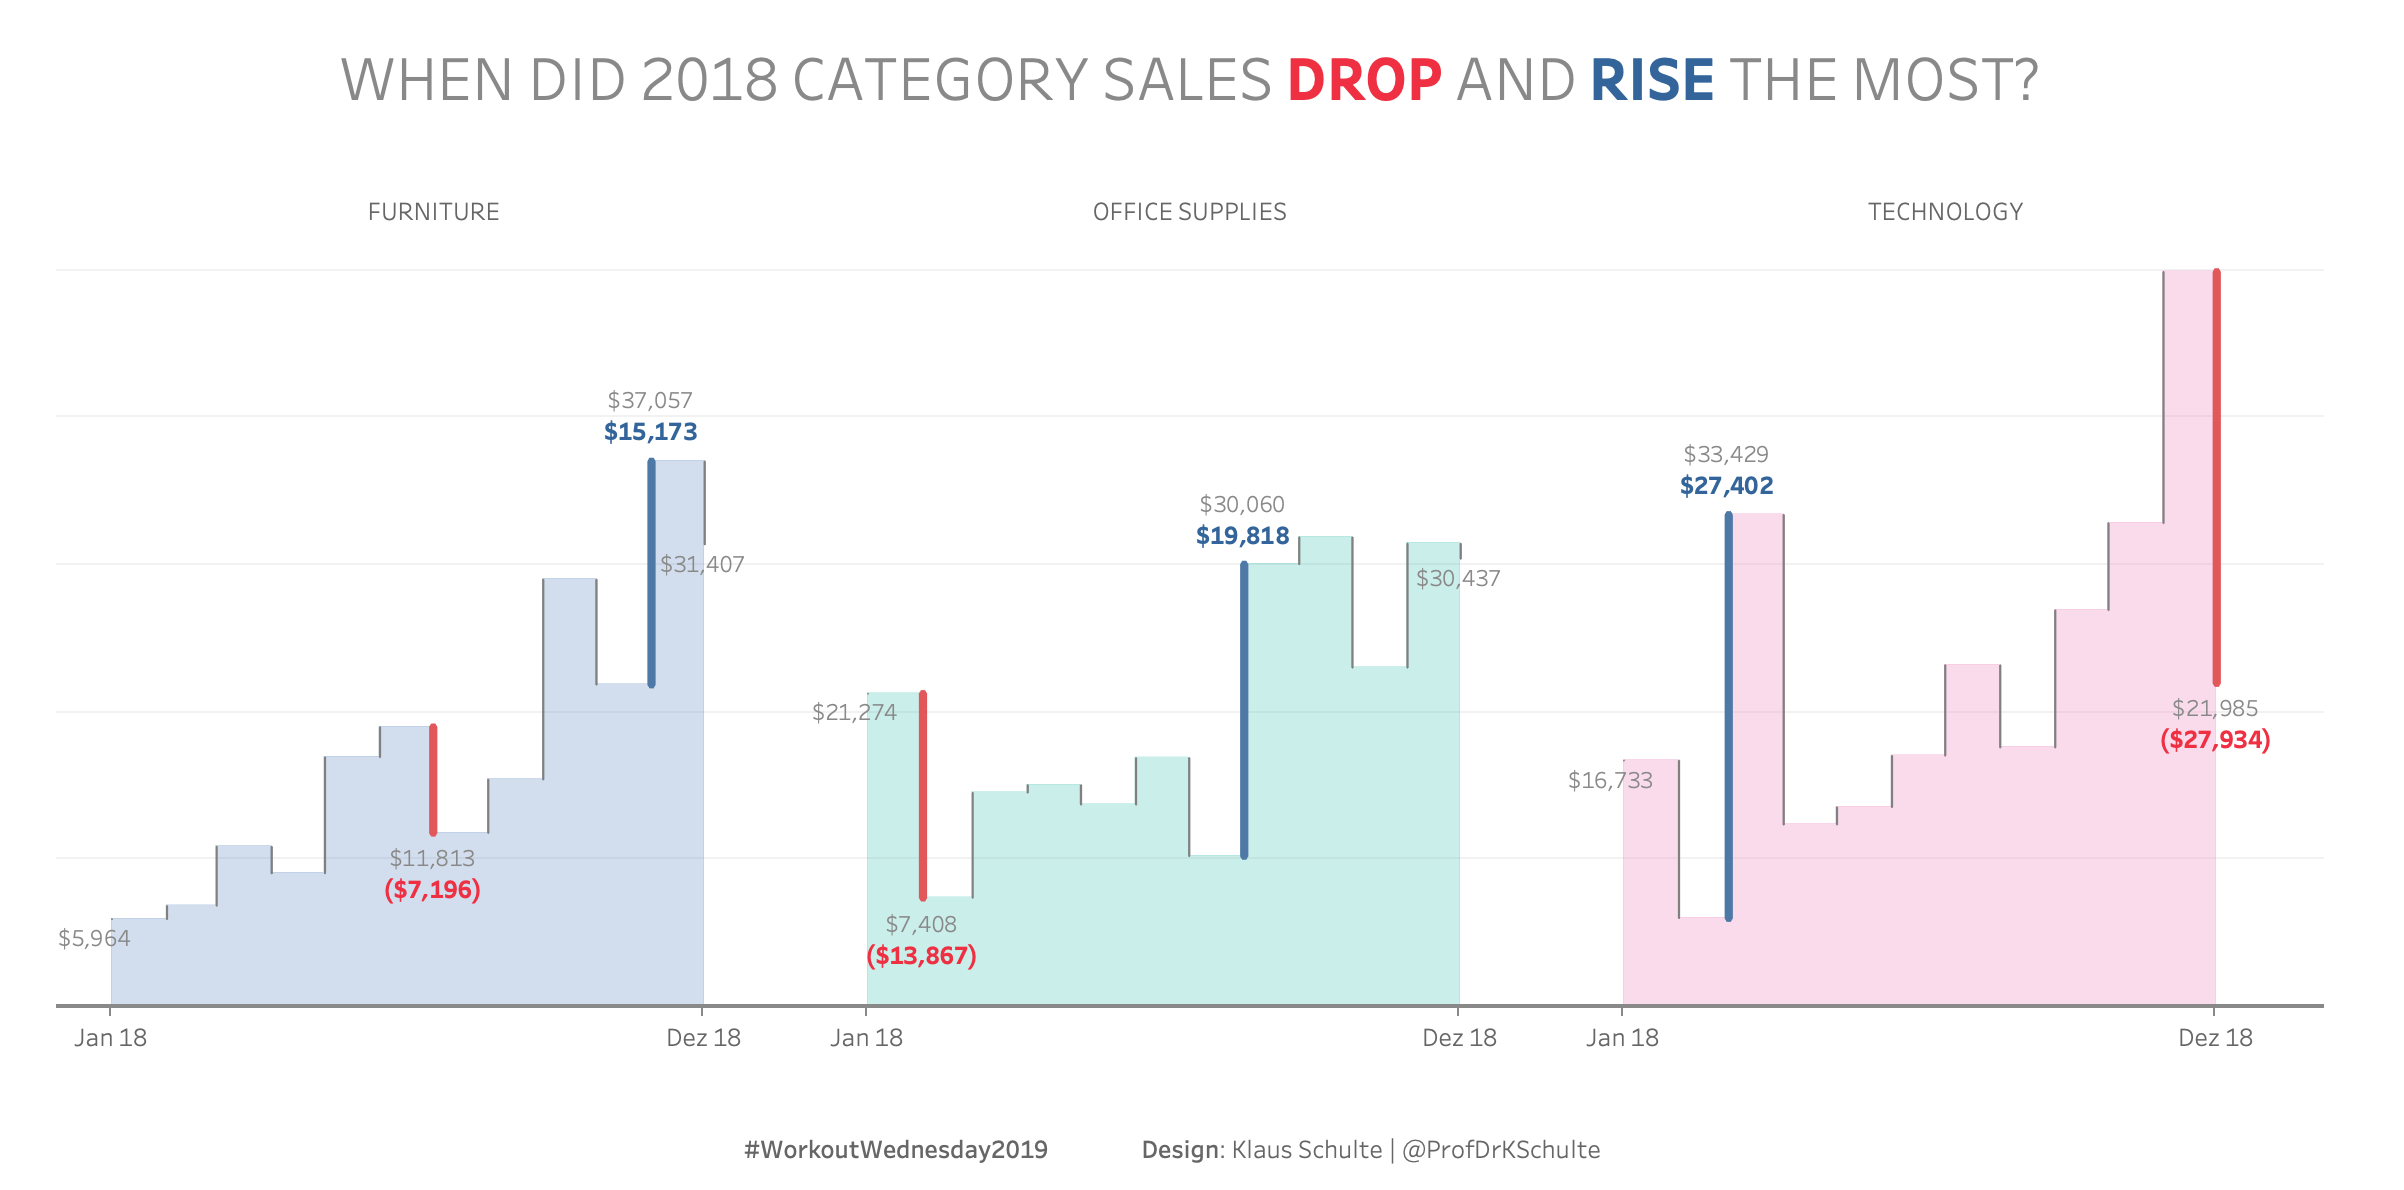
Besides the labelling, you can also use the second axis for highlighting certain months as I did in a #workoutwednesday challenge some weeks ago. Click the image to play with the interactive version on Tableau Public! Of course, you can also download the viz.

I hope you all enjoyed reading and that you will find own use cases for this. Please leave a comment below or reach out to me on Twitter @ProfDrKSchulte.