Exciting News: 5 Free Tableau Courses Now Available on YouTube!
Hello, fellow data enthusiasts!
I’m thrilled to announce that 5 of my free courses on Tableau are now available on YouTube for you to watch and learn at your own pace. Whether...
Tableau’s JavaScript API / An Introduction
In the past 5 years, I have been programming a lot with JavaScript, from simple jQuery to Angular to React. This has been mainly for my personal projects and surprisingly I have...
Tableau and Python / An Introduction
Today, Python is one of the most sought after skills in the world of Data Science, and as such, we can leverage this power in our Tableau Data Visualisations. While integration...
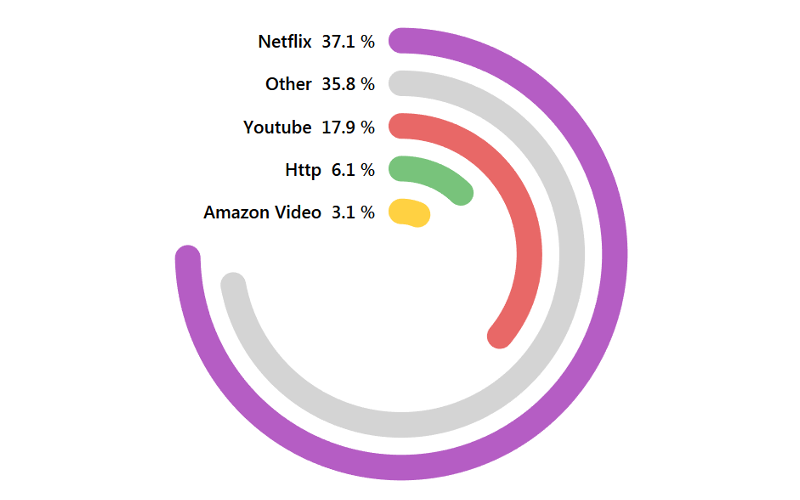
Radial Bar Chart Tutorial
I love drawing data visualisations with Tableau and in this tutorial, we are going to build Radial Bar Chart. For my data set, I am going to use the #MakeoverMonday’s American...
New Learning Platform
With every season comes a new direction, a new strategy, new fun, and given that I have been working on more video content over 2020, I decided to launch a new...
Creating a Polar Chart in Tableau
As we close down our second set of tutorials in 2020, I wanted to finally have some fun with Polar Charts, so here you have it, something that is often asked...
Creating Dendrogram with Rounded Bar Charts in Tableau
I am really having a fun moment with Dendrogram Charts, and in this tutorial, we are going to combine a Dendrogram Chart with Rounded Bar Charts to create a very nice...
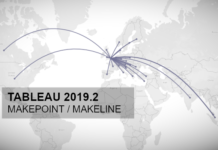
Tableau 2019.2: MakePoint and MakeLine
Tableau 2019.2 was released on Tuesday 21st May 2019 and comes with some very nice features. In this article, we are going to spend the next 10 minutes to look into...
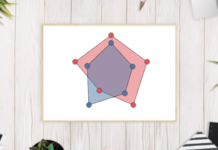
Drawing Radar Charts in Tableau
In this tutorial, we are going to have some fun and draw two overlapping Radar Charts, use transparency, and show dynamic labels. The main thing here is to have some fun...
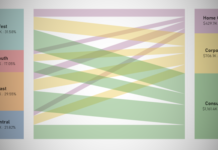
Creating Parallel Sets in Tableau
I want to end my second wave of Tableau Tutorials with something a little special. I have to admit that to create the following data visualisation, I had to make several...


