Venn Diagrams in Tableau
I was challenged a few years back to draw an interactive Venn Diagram, not just have two transparent circles, which is not too difficult, but having two circles as well as...
Creating Bar with Trend Chart in Tableau
Sometimes, I will get an idea stuck in my head, an image, a type of data visualisation, and I will obsess about it until I have figured out how to create...
Drawing a Drop Off Sankey Chart in Tableau
Tableau Magic has experienced a fantastic launch and I am extremely grateful for your support. One of the ways I have been monitoring the growth of Tableau Magic is via Google...
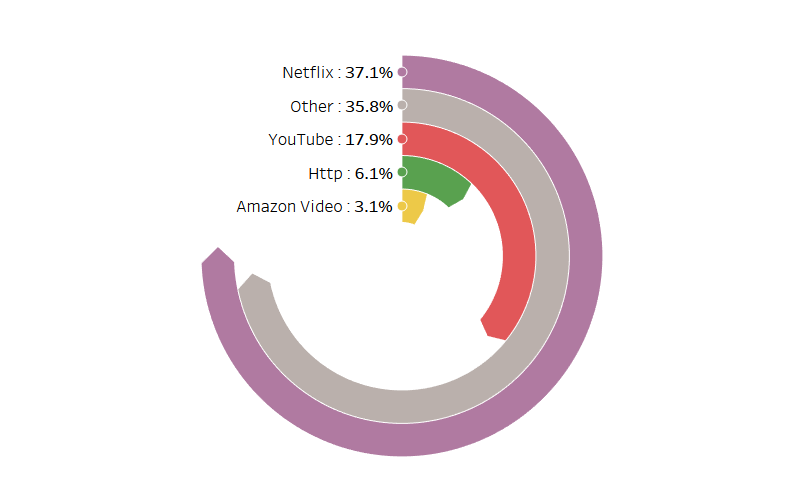
Creating Radial Stacked Bar Chart in Tableau
I saw this a while ago and thought that I would write a tutorial about creating Radial Stacked Bar Charts in Tableau; this is a Stacked Bar Chart based on Percentage...
Creating a Tableau Extension / Part Two
Two weeks ago, I wrote part one of my four-part series in Creating a Tableau Extension / Part One where we introduced Git, GitHub, Yarn, Visual Studio Code as well as Bootstrap,...
Creating a Single Level Dendrogram in Tableau
My initial name for this tutorial was the Orgasmatron (head massager company name out of Australia), the name is fun, strange as hell but we have to have some fun right?...
Creating Path Charts in Tableau
This is a tutorial that I have been wanting to write for over a year, however, the mathematics behind this really eluded me. Then one lazy Sunday, I decided to have...
Tableau Magic EpicViz vol.1
This is going to be a longer post than most as I want to give you the full idea behind this visualisation as well as show you how to combine several...
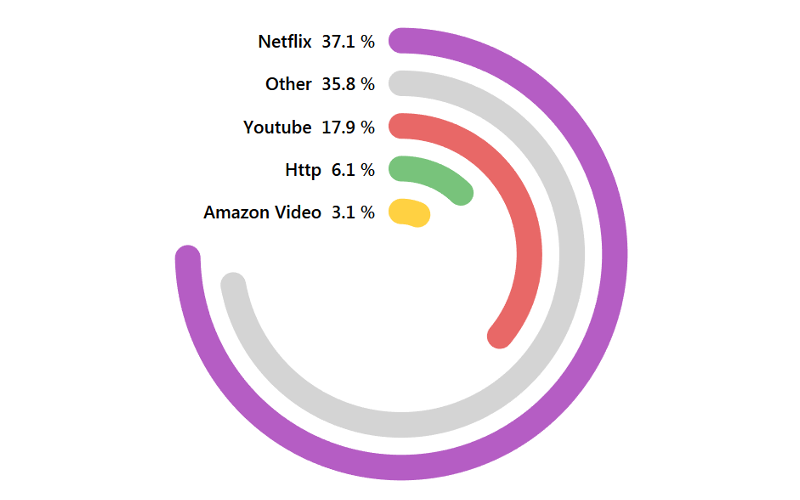
Pointed Radial Bar Chart Tutorial
In September 2016, I wrote a tutorial titled Tableau Rings which was a step-by-step guide to create a Radial Bar Chart. To my surprise, this tutorial went on to be my...
Creating a Tableau Extension / Part Three
In Creating a Tableau Extension / Part One we introduced you to Git, GitHub, Yarn, Visual Studio Code as well as Bootstrap, jQuery and the Tableau Extension API library. In Creating a Tableau Extension...


