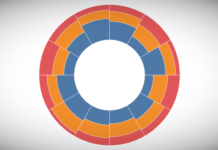
Creating a Tableau Extension / Part Four
In Creating a Tableau Extension / Part One we introduced you to Git, GitHub, Yarn, Visual Studio Code as well as Bootstrap, jQuery and the Tableau Extension API library. In Creating...
Creating Bar with Trend Chart in Tableau
Sometimes, I will get an idea stuck in my head, an image, a type of data visualisation, and I will obsess about it until I have figured out how to create...
Creating Parallel Sets in Tableau
I want to end my second wave of Tableau Tutorials with something a little special. I have to admit that to create the following data visualisation, I had to make several...
Creating a Web Data Connector / Part 1
One of the top features of Tableau is that they provide out-of-the-box connectivity to a variety of common data sources; the number of supported data sources is increasing with every release...
Drawing a Drop Off Sankey Chart in Tableau
Tableau Magic has experienced a fantastic launch and I am extremely grateful for your support. One of the ways I have been monitoring the growth of Tableau Magic is via Google...
Creating a Single Level Dendrogram in Tableau
My initial name for this tutorial was the Orgasmatron (head massager company name out of Australia), the name is fun, strange as hell but we have to have some fun right?...
Creating Path Charts in Tableau
This is a tutorial that I have been wanting to write for over a year, however, the mathematics behind this really eluded me. Then one lazy Sunday, I decided to have...
Creating Square Arc Charts in Tableau
I hope you enjoy this last tutorial before I go on my first break of 2020. This is the technique that I used to create my Premier League Data Visualisation, which...
Venn Diagrams in Tableau
I was challenged a few years back to draw an interactive Venn Diagram, not just have two transparent circles, which is not too difficult, but having two circles as well as...
Creating Radial Stacked Bar Chart in Tableau
I saw this a while ago and thought that I would write a tutorial about creating Radial Stacked Bar Charts in Tableau; this is a Stacked Bar Chart based on Percentage...


