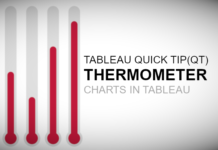
Tableau QT: Thermometer Chart
This is a Quick Tip on how to build a Thermometer Chart in Tableau, so less reading and more jumping in. We are going to spend 5 minutes or less building...
Exploring Jitter Plots in Tableau
Sometimes you read something and you just want to have fun, so therefore, I decided to write a short blog to introduce the RANDOM() function in Tableau and to use this...
Drawing a Circle Dot Chart
I saw the following while looking for inspiration and thought that this would be fun to build, to build this visualisation as well as to include some neat variations. This should...
Tableau QT: Waterfall Chart
This is a Quick Tip on how to build a Waterfall Chart in Tableau, so less reading and more jumping in. We are going to spend 5 minutes or less building...
Tableau QT: Shape Bar Chart
This is a Quick Tip on how to build a Shape Bar Chart in Tableau, so less reading and more jumping in. We are going to spend 5 minutes or less...
Radial Fan Charts in Tableau
I was looking for inspiration for my second Epic Viz and thus was experimenting with Tableau to see what can be done. In the process, I put together a Radial Fan...
Drawing Daisy Charts in Tableau
On my way home from the London Tableau User Group (TUG) I was looking at Twitter and got inspiration from Kevin Flerlage (@FlerlageKev) and Rajeev Pandey (@rajvivan), so I thought I...
Tableau Magic EpicViz vol.1
This is going to be a longer post than most as I want to give you the full idea behind this visualisation as well as show you how to combine several...
Tableau QT: Sin-Dumbbell Chart
This is a Quick Tip on how to build a Sin-Dumbbell Chart in Tableau, so less reading and more jumping in. We are going to spend 5 minutes or less building...
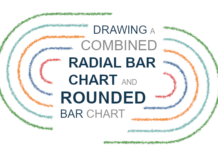
Drawing a Combined Radial and Rounded Bar Chart in Tableau
I was browsing Pinterests for interesting visualisations and came across a visualisation that combined a Radial Bar Chart with a Rounded Bar Chart, and as such, I knew that I had...


