Tableau QT: Ratings Chart
This is a Quick Tip on how to build a Ratings Chart in Tableau, so less reading and more jumping in. We are going to spend 5 minutes or less building...
Tableau QT: Dual Line Charts
This is a Quick Tip on how to build a Dual Line Chart in Tableau, so less reading and more jumping in. We are going to spend 5 minutes or less...
Tableau QT: Curved Lines
This is a Quick Tip on how to build a Curved Line Chart in Tableau based on the Sigmoid Function, so less reading and more jumping in. We are going to...
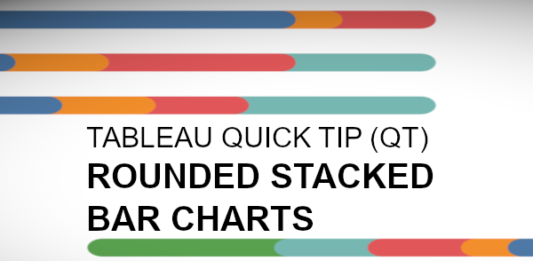
Tableau QT: Rounded Bar Charts
This is a Quick Tip on how to build a Rounded Bar Charts in Tableau, so less reading and more jumping in. We are going to spend 5 minutes or less...
Tableau QT: Arrow Bar Charts
This is a Quick Tip on how to build Arrow Bar Charts in Tableau, so less reading and more jumping in. We are going to spend 5 minutes or less building...
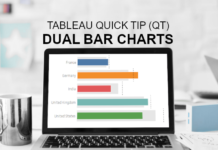
Tableau QT: Dual Bar Charts
This is a Quick Tip on how to build Dual Bar Charts in Tableau, so less reading and more jumping in. We are going to spend 5 minutes or less building...
Tableau QT: Dumbbell Charts
This is a Quick Tip on how to build Dumbbell charts in Tableau, so less reading and more jumping in. We are going to spend 5 minutes or less building our...
Tableau QT: Lollipop Charts
This is a Quick Tip on how to build lollipop charts in Tableau, so less reading and more jumping in. We are going to spend 5 minutes or less building our...
Tableau QT: Doughnut Charts
This is a Quick Tip on how to build doughnut charts in Tableau, so less reading and more jumping in. We are going to spend 5 minutes or less building our...


