

In the fourth part of our introduction to Tableau Series, we are going to look at the main building block within Tableau, the worksheet. To do this, we are going to explore the Tableau Workspace (and its various options) for building worksheets.
But before that, a few definitions.
- A Worksheet contains a single view along with shelves, cards, legends, and the Data and Analytics panes in its sidebar.
- A Dashboard is a collection of views from multiple worksheets.
- A Story contains a sequence of worksheets or dashboards that work together to convey information.
We will talk about Dashboards and Stories in future articles, but for let us start by accessing a data source and exploring your Workspace.
Workspace
Open Tableau Desktop, pick a data source and let us have a look at the Workspace.

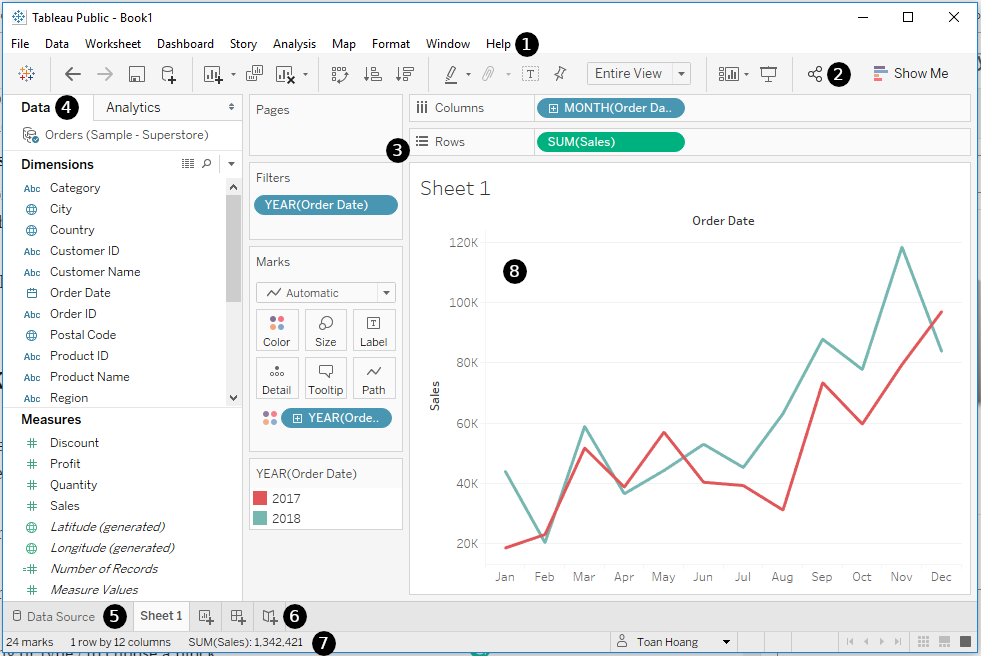
Let us look into th various components:
- Application Menu Bar – like most Menu bars, the key functionality is from left to right.
- Application Toolbar – Use the toolbar to access commands, analysis and navigation tools.
- Cards and Shelves – Drag fields onto cards and shelves in the workspace to add data to your view. We will be digging deeper into Cards and Shelves in this article.
- Sidebar – The sidebar area contains the Data Pane and the Analytics Pane.
- Data Pane – Shows you the currently available data source fields and calculated fields.
- Analytics Pane – Provides drag and drop analytics to speed up your development.
- Go to Data Source – Allows you to view and edit your data sources.
- Create Buttons – Allows you to create new WOrksheets, Dashboards and Stories.
- Status Bar – Shows you various information about your current selection as well as other details.
- View – This is where you view and customize your Data Visualisation.
Like any tool, it is important to understand and be familiar with your workspace as it will improve your productivity. We will now build a worksheet and intentionally using as much of the workspace as possible.
Worksheet
Let us build our Tableau Worksheet and explore the different elements by copying the following table and pasting into Tableau (literally, highlight all, copy and paste):
| Country | Sales |
| United States | £1,203,001 |
| United Kingdom | £708,150 |
| France | £610,005 |
| Germany | £290,070 |
| Australia | £160,600 |
Once you have copied this simple table into Tableau, Tableau will show you the Workspace and Country and Sales should now be visible in your Data Pane.
Note: Tableau will look into your data and will try to set the most appropriate data type as well as the field types. For example, Country has been set as a Discrete Dimension and Sales has been set as a Continuous Measure, more on this in the next part of this tutorial.
Now let us:
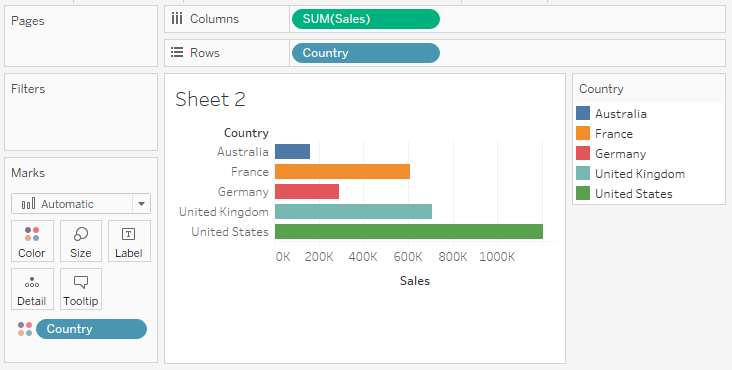
- Left-click on Country and drag Country from the Data Pane and drop it onto the Rows Shelf.
- In the Data Pane, double left-click on the Sales to automatically add this to our view; Tableau will try to figure out the best place to put this item. In our case, Tableau has added SUM(Sales) to the Text Mark on the Marks Panel.
- Given that Sales is a Measure, Tableau will always try to wrap the Field with an aggregation.
- I now want us to change our visualisation by dragging Sales on the Text Mark to Rows. This means that we will have a Country per row of data and along the X-axis we will have Sales. By default, Mark Type is defaulted to Automatic and therefore Tableau will try to choose the most appropriate Mark Type.
- The Rows and Columns allow you to segment your View.
- The Mark Panel allows you to set how the data within the view is display. I always imagine this as my brush strokes.
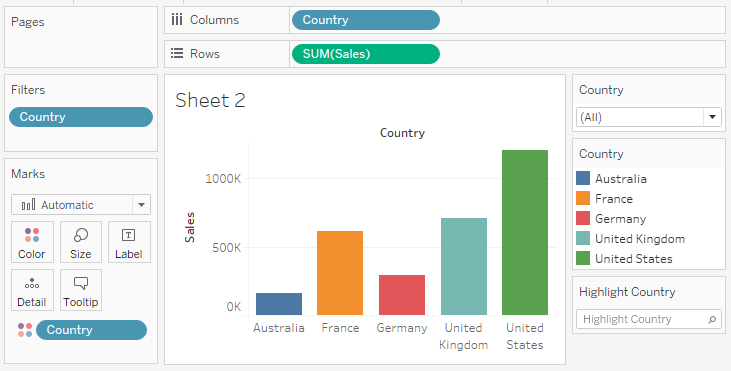
- Now left-click and drag Country from the Data Pane and drop this onto the Color Mark. Yes, you can use items in your Data Pane multiple times in your view.
- Now you will see that Tableau has assigned a unique Color for each Country. Again, Tableau does this automatically for you. You can click on the Color Mark to change the . We will explore this in future articles in this series.
If we have followed the steps correctly, we should see something like the following:

Now we will use explore a few more features and edit our view.
- In the Application Toolbar, hover over the various buttons and click on Swap Rows and Columns.
- In the Application Toolbar, change the Fit setting from Standard to Entire View.
- Drag Country onto the Filters Card.
- Look at the various options in the Filter window, but for now, leave the options as is, and click Ok.
- Right-click on Country in the Filter Card and select Show Filter and select Show Highlighter; this adds tremendous functionality to your view.
- Hover over the newly appeared Country Card, and click on the down carrot and choose Multiple Value (dropdown).
We are now in a position where we can see a visual representation of our data which uses size and to distinguish between countries. We also have filters (and highlight) the countries that we are focused on. We should see the following:

Now it is time for you to explore:
- Click on the Mark Type in the Marks Card and change the type from Automatic to see what is available.
- Click on the Color, Size, Label and Tooltip in the Marks Card and see what options are available.
- Select multiple Bars and see what is shown in the Status Bar; also check out the options available in the Command Bar which pops up when you select any marks in the View.
- In the Application Toolbar, click on Show Me and choose a different Visualisation.
And that is the end of this tutorial. I hope that you have not gotten a little more information about the Tableau Workspace and starting to develop an idea about how to build a Tableau Worksheet. In the next part of this series, we will explore the Marks Card in more depth.
Summary
In this part of our introductory series, we explored how we can build worksheets and the various different elements.
I hope you enjoyed this tutorial, and look forward to the next one. I am always looking for ways to help share knowledge around the community, so if you want to know more about something, and wish there was a tutorial out there, do get in touch on Twitter at @Tableau_Magic.
- Introduction to Tableau (TAB101).
- Installation of Tableau Desktop (TAB102).
- Data Sources and Connectivity (TAB103).
- Building Worksheets (TAB104).
- Exploring Marks (TAB105).
- Exploring Calculated Fields (TAB106).
- Exploring Filters (TAB107)
- Exploring Parameters (TAB108).
- Exploring Sets (TAB109).
- Building Dashboards (TAB110).
- Exploring Layouts (TAB111).
- Exploring Actions (TAB112).
- Advanced Calculations:
- Table Calculations (TAB113)
- Level of Details (LOD) (TAB114)