B19. Introducing Design
In this section, we will talk about finding inspiration, sketching and designing your Bespoke Data Visualisations in Tableau.
B17. Additional Bespoke Data Visualizations
We have now learned quite a lot and practice does make perfect. Please follow the links below and complete the various exercises to reinforce your knowledge and learned techniques.
B07. Introducing Core Techniques
In this section, we are going to cover all the core Tableau techniques required to create Bespoke Data Visualizations.
B16. Drawing a Radial Bar Chart
In this video, we will be creating a Radial Bar Chart in Tableau. We will be using Data Densification and leveraging various Table Calculations in our bespoke data visualisation.
B01. Introduction
Hello, my name is Toan Hoang, and I am going to be your instructor for this course on Creating Bespoke Data Visualisations in Tableau. So let me introduce myself.
B32. Practice Makes Perfect
Check out the following tutorials for you to get through. Given you have come all this way and completed the course, you will be in a better place to understand how these bespoke data visualisations work, and hopefully, they will spark off your imagination.
B24. What is a Sunburst
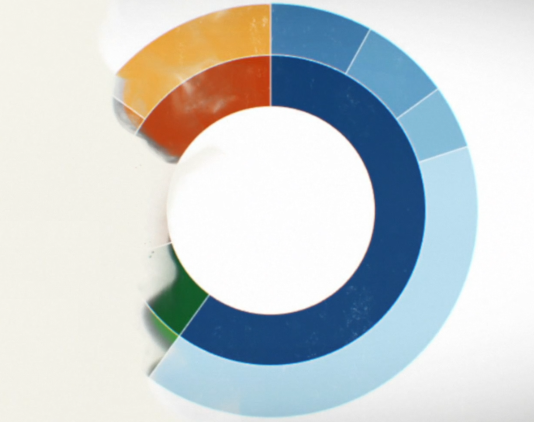
We are going to explore a Sunburst Chart. We will look at when could it be used, what use cases could it be appropriate for and, more importantly, when not to use it.
B15. Drawing a Packed Circle
In this lecture, we will be reinforcing our knowledge on our learned techniques to create a Packed Circle Chart in Tableau. We will be drawing circles and sizing them based on our data set.
B18. Core Technique Summary
We have covered a lot of grounds and have learned some of the available core techniques that we require to build bespoke data visualisations. So let us review.
B23. Design Summary
A lot of people look at visualizations and think that they can never build it, however, this could not be further from the truth. Once you see a data visualization, you can distil, sketch and design a bespoke visualisation that can be built in Tableau.


